


Gold Miners vs. the S&P - Surprising Conclusions
Commodities / Gold and Silver Stocks 2013 Feb 07, 2013 - 10:28 AM GMTBy: Casey_Research

 We often hear the claim that gold producers have not met investors' expectations for the past couple years. While there are many potential reasons for this, one explanation for their underperformance lies in the fact that producers diluted their share structures, leaving shareholders with smaller gains than they would have otherwise harvested.
To show how this dilution has impacted the industry, let's first review how gold miners performed last year compared to the S&P 500.
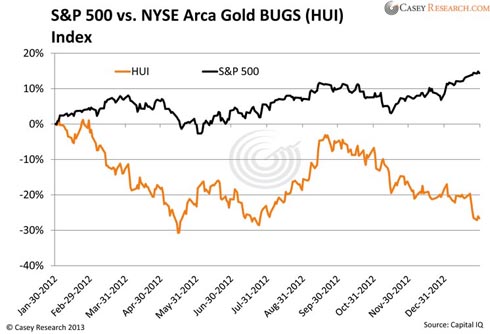
The chart is hardly a surprise: the precious-metals producers had a poor showing, losing 26.6% in 2012 – something we think will reverse this year – while stocks in the S&P 500 delivered a solid 14.2% annual gain.
We think that while last year's performance of the S&P 500 companies is commendable, the future may disappoint investors who believe the US economic recovery is on solid footing: last week's GDP data suggest that our economy continues to struggle, something that was immediately reflected in the price of gold the day the news was released. As 2013 progresses, we expect to see more signs of a weaker economy and subsequently, stronger gold prices.
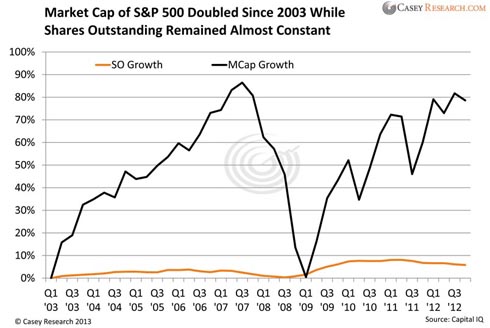
But let's look at the bigger picture to see how the S&P 500 has expanded as a group during the past decade. To measure the rate of expansion, we plotted the total market capitalization against growth of shares outstanding. The idea here is to compare the rate of S&P 500 share dilution to the change in size of the companies. Size does not equal performance (we'll look at that in a moment), but it gives a rough idea about how much market value investors may have gained had there been no dilution at all.
[Technical note: We did not include all S&P 500 companies in the above chart – only those for which share structure data was available since the first quarter of 2003. For example, Google went public in 2004 and was not included. We followed the same method with the HUI Index, with the only stock excluded being New Gold Inc. (T.NGD).]
Since there is little growth in shares outstanding, the majority of the market capitalization (Mcap) growth can be attributed to share price performance.
The total Mcap of the S&P 500 increased by 78.6%, or about 6% per year on a compounded basis. And no wonder – the sector includes a lot of large stocks that do not grow at the same rate as mining juniors. However, the chart also shows how quickly market value can shrink when a crisis hits.
Let's now have a look at what happened to the HUI constituents within the same time frame.

There are two observations to be made from these charts. First, compared to S&P 500 companies, gold producers grossly overissued new shares. Since 2003, as a group, they more than doubled their shares outstanding, significantly diluting existing investors.
Second, despite the large increase in shares outstanding, HUI companies have grown their market capitalization by 302.5% as of the fourth quarter of 2012, quadrupling the size of the group. This comes in stark contrast to the 78.6% growth of the S&P 500. On a compounded annual basis, gold companies grew at 14.9% annually for the last ten years, more than twice as fast as the S&P.
So while shares outstanding of the gold miners were increasing at a high rate, the market capitalization of the HUI constituents outpaced the growth of shares outstanding, because the assets miners purchased with the funds they received from the new shares generated extra value. Since market capitalization doesn't necessarily expand when new shares are issued, it's the price performance that accounts for this growth.
Looking at the next chart, you can see that the performance of gold stocks continues to be both stronger and more volatile than the S&P 500. Note that we didn't modify the indexes here – these are the performance numbers that cinvestors have been looking at for the past decade, and they make the case that the gold-mining sector has been far from lackluster.
The gold-mining sector has been outperforming the S&P 500 for the vast majority of the last decade.
With this focus on efficiency and economics, gold companies should richly reward those bold enough to invest in them now. But there’s another way to play the gold market that doesn’t involve buying producers, nor does it require buying the yellow metal itself. And it could be even more profitable...
© 2013 Copyright Casey Research - All Rights Reserved
Disclaimer: The above is a matter of opinion provided for general information purposes only and is not intended as investment advice. Information and analysis above are derived from sources and utilising methods believed to be reliable, but we cannot accept responsibility for any losses you may incur as a result of this analysis. Individuals should consult with their personal financial advisors.
Casey Research Archive |
© 2005-2022 http://www.MarketOracle.co.uk - The Market Oracle is a FREE Daily Financial Markets Analysis & Forecasting online publication.