


US Stock Market Uptrend Continues While Europe Weakens
Stock-Markets / Stock Markets 2013 Feb 10, 2013 - 12:38 PM GMTBy: Tony_Caldaro

 A choppy but interesting week. The market had 1% swings several days this week, after it had remained in a 1% range for the entire previous week. In the end, new uptrend highs and the uptrend reached the OEW 1523 pivot range on friday. For the week the SPX/DOW were mixed, and the NDX/NAZ were +0.45%. Foreign markets did not do as well. The Asian markets were -0.3%, European markets were -1.3%, and the DJ World index was -0.4%. Economic reports for the week were light, but remained with a positive bias. On the uptick: factory orders, the monetary base and the WLEI, plus weekly jobless claims and the trade deficit improved. On the downtick: ISM services, consumer credit and wholesale inventories. Next week we get retail sales, industrial production and consumer sentiment.
LONG TERM: bull market
While some are still calling this four year bull market a bear market rally. The NAZ hit its highest closing level since 2000, and we at OEW are still counting uptrending impulse waves from the Mar09 low. One may be wondering what is driving this bull market, while GDP growth has remained meager and some have remained pessimistic throughout. The following chart, which we have been tracking since 2010, illustrates the FED’s liquidity programs: QE 1, QE 2 and currently QE 3 are the driving force. The liquidity created by the expanding monetary base.
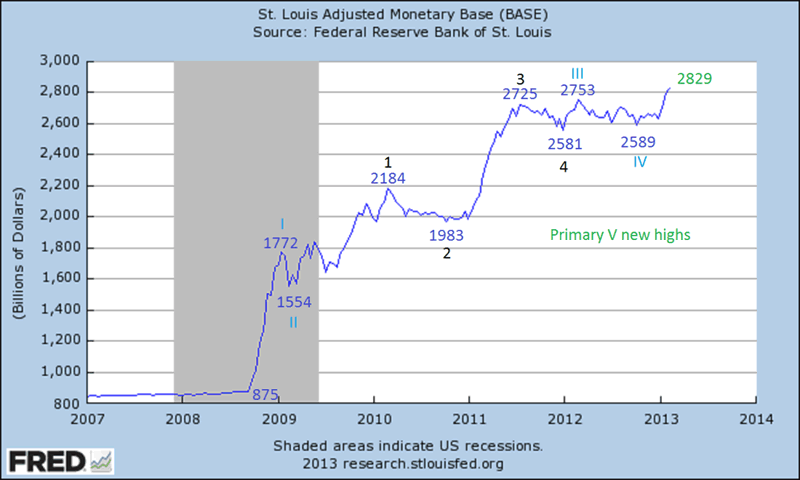
Notice as the FED increased the monetary base from $875 bln in late-2008 to currently $2.829 tln, with the three quantitative easing programs noted above. The rise has unfolded incrementally in Elliott waves. QE 1 created Primary I and Major 1, QE 2 created Major 3 and the completion of Primary III. Now QE 3 is creating Primary wave V. The stock market, however, bottomed in March 2009 only after the monetary base had doubled. This is similar to what occurred during the last deflationary Secular cycle 1929-1949. When FDR doubled the monetary base in early 1933, by calling in all the gold in the country to the treasury and then increasing the price of Gold from $20.67 to $35.00 an ounce. We were on a gold standard then. FED chairman Bernanke knows his history.
While the monetary base has continued to climb, the stock market has risen in Elliott waves of its own. We have been counting the March 2009 SPX 667 low as the beginning of a multi-decade Supercycle bull market. Just as we have counted the July 1932 DOW 40 low as the beginning of the last multi-decade Supercycle bull market. The one that ended at DOW 14,198 in October 2007. Supercycle bull markets unfold in five Cycle waves. Cycle wave [1], after the 1932 low, lasted five years. This Cycle wave [1] is currently in its fourth year.
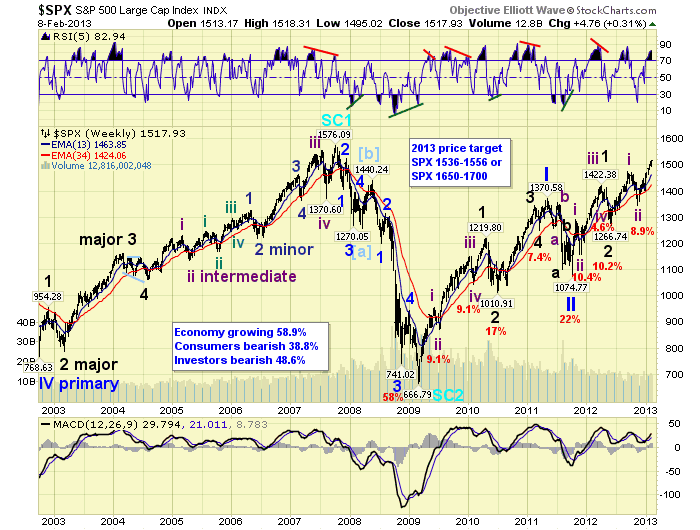
Cycle waves unfold in five Primary waves. In this bull market Primary waves I and II completed in 2011 at SPX 1371 and 1075. Primary wave III has been underway since then. Primary wave I divided into five Major waves with a subdividing Major wave 1. Primary III is following a similar path, but Major wave 3 is also subdividing. Major waves 1 and 2 ended in 2012 at SPX 1422 and 1267. Major wave 3 has been under way since that low. Major wave 3, just like Major 1, is subdividing into five Intermediate waves. Intermediate waves i and ii also completed in 2012, but at SPX 1475 and 1343. Intermediate wave iii is the current uptrend, and it has already made new bull market highs.
MEDIUM TERM: uptrend
The current uptrend, Intermediate wave iii, has been naturally unfolding in five Minor waves. Minor wave 1 was relatively easy to count, it unfolded in five Minute waves with a subdividing Minute wave i, and ended at SPX 1424. This count is posted on the hourly chart. Minor wave 2 was complex and unfolded in an irregular flat, ending at SPX 1398. Minor wave 3 has been rising since that low, and was relatively easy to count until it hit SPX 1510 a week ago wednesday. After that the market had more significant pullbacks, but continued to make slightly higher highs on the rallies.
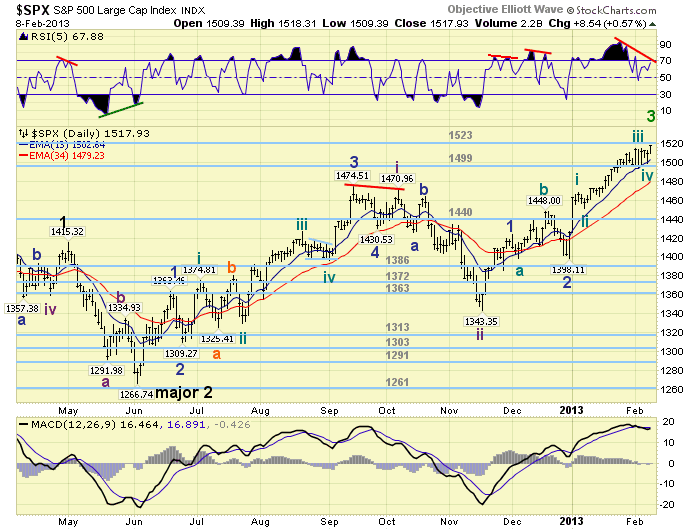
We posted a count in last weekend’s report, and remained with that count until late friday. Now it is clear there was an extended wave within nano wave iii. This Minor wave 3 has subdivided into five Minutes waves, five Micro waves, five Nano waves, and even five Pico waves. We are out of waves labelings at the Pico level so these extensions should end soon. This choppy week, and relentless upward churning, nevertheless, has carried Minor wave 3 into our target: the OEW 1523 pivot range, (1516-1530). With a negative divergence now starting to unfold on the daily chart, we believe this pivot range will contain the progress of Minor wave 3. Then a Minor wave 4 pullback, between 30 and 44 points should follow. After that another Rally, Minor wave 5, into the OEW 1552 pivot is expected. Medium term support is at the 1499 and 1440 pivots, with resistance at the 1523 and 1552 pivots.
SHORT TERM
Short term support remains at the 1499 pivot and 1471/75, with resistance at the 1523 and 1552 pivots. Short term momentum hit overbought on friday and ended there. The short term OEW charts remain positive, after a couple of swings both ways this week, with the reversal level now at SPX 1507.
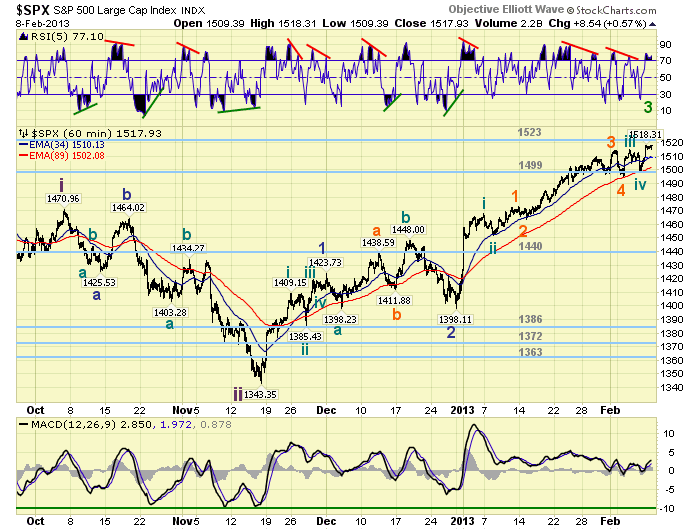
We adjusted, based on recent market activity, the high of Micro wave 3 to SPX 1514. This puts Micro 4 at SPX 1495, then Minute waves iii and iv at SPX 1515 and 1498 respectively. Minute wave v of Minor 3, should be underway now. Typically, during this bull market, Minor waves have unfolded in distinctive patterns. We have not seen that pattern to suggest a Minor wave 4 has occurred. Therefore we are labeling this rally from SPX 1398 as a continuation of Minor wave 3. However, we are now carrying an alternate count on the DOW charts suggesting Minor wave 3 and 4 have already occurred. The deciding factor, at this point, would be the OEW 1523 pivot. Should it be cleared before a sizeable pullback occurs, then the DOW count becomes primary. If not we would expect a sizeable pullback after this rally ends. Extending, subdividing waves, are always difficult to anticipate and count in real time. Best to your trading.
FOREIGN MARKETS
The Asian markets were quite mixed on the week losing 0.3%. We now have two indices in confirmed downtrends: S. Korea and India.
The European markets were all lower except for Greece and lost 1.3%. We now have four of the eight indices we track in confirmed downtrends: France, Germany, Spain and the Stox.
The Commoditiy equity group was mostly lower for a net lost of 2.2%. Brazil is now downtrending.
The DJ World index is still uptrending but lost 0.4% on the week. This week the selling in Europe, and other areas, have shifted the world scene from 100% uptrending to only 65% uptrending. This typically occurs when the US is getting close, within weeks, to an end of its uptrend.
COMMODITIES
Bonds continue to downtrend but gained 0.5% on the week.
Crude remains in an uptrend but lost 1.9% on the week.
Gold is still trying to get an uptrend going but ended the week flat.
The USD is still downtrending, but gained 1.4% on the week.
NEXT WEEK
Tuesday kicks off the economic week with the Budget deficit. Wednesday: Retail sales, Export/Import prices, and Business inventories. Thursday: weekly Jobless claims. Then on friday: the NY FED, Industrial production and Consumer sentiment. The FED has a speech and testimony scheduled. Monday: vice chair Yellen speaks at 1:00 in Wash., DC. Thursday: FED Governor Tarullo testifies before the senate on Dodd-Frank. Best to your weekend and week.
CHARTS: http://stockcharts.com/...
http://caldaroew.spaces.live.com
After about 40 years of investing in the markets one learns that the markets are constantly changing, not only in price, but in what drives the markets. In the 1960s, the Nifty Fifty were the leaders of the stock market. In the 1970s, stock selection using Technical Analysis was important, as the market stayed with a trading range for the entire decade. In the 1980s, the market finally broke out of it doldrums, as the DOW broke through 1100 in 1982, and launched the greatest bull market on record.
Sharing is an important aspect of a life. Over 100 people have joined our group, from all walks of life, covering twenty three countries across the globe. It's been the most fun I have ever had in the market. Sharing uncommon knowledge, with investors. In hope of aiding them in finding their financial independence.
Copyright © 2013 Tony Caldaro - All Rights Reserved Disclaimer: The above is a matter of opinion provided for general information purposes only and is not intended as investment advice. Information and analysis above are derived from sources and utilising methods believed to be reliable, but we cannot accept responsibility for any losses you may incur as a result of this analysis. Individuals should consult with their personal financial advisors.
Tony Caldaro Archive |
© 2005-2022 http://www.MarketOracle.co.uk - The Market Oracle is a FREE Daily Financial Markets Analysis & Forecasting online publication.