


Gold Triggers Buy Signal
Commodities / Gold and Silver 2013 Feb 11, 2013 - 06:01 PM GMTBy: Toby_Connor

 The weekly stochastic and TDI indicators produced a "buy-signal" in the gold market (and various ETFs for gold) in January 2013. The most profitable "buy signals" occurred when the TDI was low and gold had just finished a large percentage correction, such as in late 2008. The January 2013 "buy signal" is similar to the "buy-signal" from 2008. Within the trend channel that stretches back to 2005, there is room for gold to move higher toward $3,500 per ounce within the next two years. Gold probably will not rally that high in 2013, but new highs above $1,900 seem very likely, based on gold's price history, the current "buy-signal," and the financial traumas in the world that will cause additional "money printing" and consumer price inflation.
The Detailed Analysis
Question: What do February 2005, June 2005, October 2006, July 2007, September 2008, November 2008, December 2011, June 2012, and January of 2013 have in common?
Answer: They represented significant price lows in gold AND those lows were confirmed by the weekly stochastic (14,3,3) indicator and the weekly TDI Trade Signal Line (13,5) as shown in the following chart of gold prices since 2005. Note the green circles showing price lows and corresponding turns in the stochastic and TDI indicators from oversold levels.
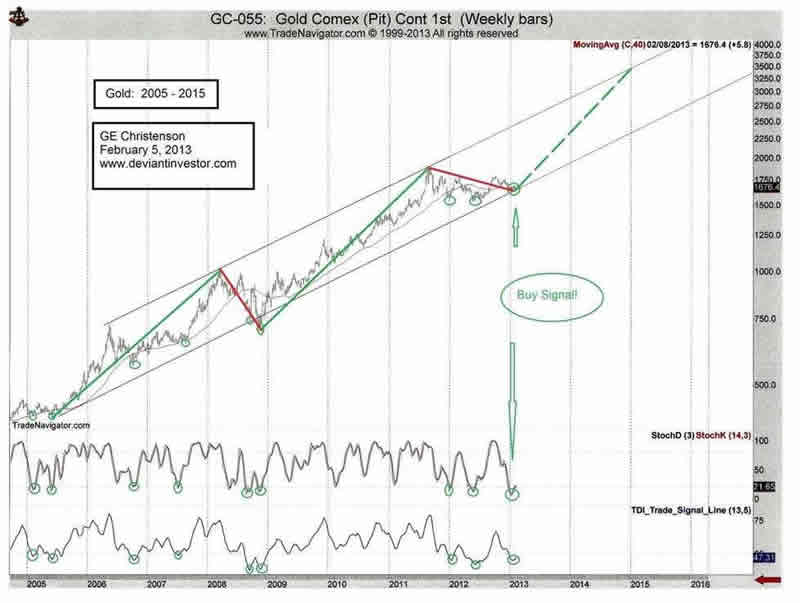
The ten year chart of gold prices is plotted on a logarithmic scale and shows an exponential increase in prices over that ten year period. Note the higher trend line extends to approximately $3,500 by the end of 2014. Prediction - Certainly Not! Possibility - Yes! Jim Sinclair targets a gold price of $3,500 on its way to much higher prices.
The highs in 2006, 2008, and 2011 reached that trend line. A price of $720 in 2006 was just as extreme as the $1,900 price in 2011 and a possible $3,500 price within the next two years. Will gold prices spike that high? Time will tell, but before you dismiss such a price as unlikely, consider the following:
- Will the US government balance its budget and eliminate deficit spending? The increase in national debt correlates strongly over the last decade with the increasing price of gold. Read $4,000 Gold! Yes, But When?
- Will the Federal Reserve reduce the monetary base and cease "printing money?" Eventually consumer price inflation will become much worse, and people will transfer digital money into real money, thereby driving up the price of gold. The average family can help preserve their purchasing power with gold and silver.
- Will in excess of $700,000,000,000,000 in derivatives "work out well" with no disasters, defaults, or destruction? Consider Enron, Bear Stearns, Lehman Brothers, MFGlobal, Fannie Mae, Greece, Spain, France, missing gold from bank vaults, and peace prospects in Middle East.
- Will the world become a safer and saner place in the next few years? Why have guns sales gone ballistic since early November? Why are certain types of ammunition all but unavailable? Why did the US Mint halt production of Silver Eagles in December? Why did Gold and Silver Eagles set sales records last month? Are conditions in the financial world as optimistic, safe, and sane as the commentators on financial TV want us to believe?
So is $3,500 gold possible? The better question is "How soon will we see $3,500 gold?"
Details Of The Graphical Analysis
- The chart shows weekly price data plotted on a logarithmic scale. The stochastic and TDI indicators are standard indicators.
- The stochastic indicator is considered "oversold" when it sinks below 20 on a scale from 0 to 100. It is usually considered a "buy-signal" when the stochastic is oversold and then turns higher along with price.
- The TDI (scale 0 to 100) is "oversold" below 50. The best "buy-signals" occur when it is very low - such as 42 - and then turns up.
- The green circles show "oversold" and turning up stochastic and TDI conditions along with the price lows in gold.
- Each green circle indicates a tradable price low, but some were better than others. For example, missing the early 2005 low was unimportant since there was another good low later in 2005. Similarly, the December 2011 price was not as low as the excellent buy point in June 2012.
Conclusion
The weekly stochastic and TDI indicators produced a "buy-signal" in the gold market (and various ETFs for gold) in January 2013. The most profitable "buy signals" occurred when the TDI was low and gold had just finished a large percentage correction, such as in late 2008. The January 2013 "buy signal" is similar to the "buy-signal" from 2008. Within the trend channel that stretches back to 2005, there is room for gold to move higher toward $3,500 per ounce within the next two years. Gold probably will not rally that high in 2013, but new highs above $1,900 seem very likely, based on gold's price history, the current "buy-signal," and the financial traumas in the world that will cause additional "money printing" and consumer price inflation.
Read Ten Steps to Safety and Why Buy Gold?.
Now look at the above graph of gold again and ask yourself:
- Will the national debt continue its growth toward $25,000,000,000,000 and beyond?
- Will "money printing" (QE-Infinity) continue?
- Will people attempt to protect their purchasing power by selling digital money and buying real assets?
- Will the financial world become less sane and more dangerous over the next several years?
- What happened to gold prices after the other 9 "buy-signals?"
- When your financial future is at stake, do you really want to discount the prescient gold analysis of Jim Sinclair, Richard Russell, and Egon von Greyerz?
- Consequently, are much higher gold prices inevitable?
GE Christenson
aka Deviant Investor
If you would like to be updated on new blog posts, please subscribe to my RSS Feed or e-mail
© 2013 Copyright Deviant Investor - All Rights Reserved Disclaimer: The above is a matter of opinion provided for general information purposes only and is not intended as investment advice. Information and analysis above are derived from sources and utilising methods believed to be reliable, but we cannot accept responsibility for any losses you may incur as a result of this analysis. Individuals should consult with their personal financial advisors.
© 2005-2022 http://www.MarketOracle.co.uk - The Market Oracle is a FREE Daily Financial Markets Analysis & Forecasting online publication.