Gold And Silver Current Decline Not Over
Commodities / Gold and Silver 2013 Feb 16, 2013 - 06:02 PM GMTBy: Michael_Noonan
 We often make a distinction between buyers of physical precious metals, [PMs] and buyers of futures, exhorting the former to buy with impunity, and some may see that as cavalier, given how the price for both gold and silver have been in recent decline.
The point for buyers of PMs is for both protection and creation of wealth. Protection against insidious central bankers destroying currency-purchasing power, over time, and wealth creation as evidenced by those buying PMs over the past decade and seeing the intrinsic value grow dramatically.
Buyers of the physical as less price sensitive and view current declines as opportunity to add more. As an example, we still hold physical silver purchased when price was in the mid-40s. Has the relative value declined? Absolutely. Concerned? Absolutely not. It remains a matter of time when the price of PMs will go dramatically higher, and the concern will not be how much one paid, $1800 or $1600 the ounce for gold, or $45 or $30 the ounce for silver. The concern will be over having any at all.
If gold is to go to $3,000, $4,000 $5,000, or wherever, and silver go to $100, $150, or $250, there will be many who will be glad to have paid $2,500 the ounce for gold, and $75 the ounce for silver. How does that compare to $1,800 and /or $45 purchases for physical PMs, at this point? One cannot always time the market, which is why consistent buying over time is strongly recommended, but one can determine whether to be an owner of PMs, or not.
The problem moving forward is fear of central bankers changing the rules and precluding the purchase of any PMs by the public, at any price. Death and taxes are touted as the two things one cannot escape, [not always true for the latter], but the certainty of lies and deception by central bankers/planners runs an immediate third place.
The handwriting is on the wall, as most in PMs know only too well. We mention this for those on the fence, those waiting for "bargains," [misplaced values, there], and those who have not yet purchased any PMs. Do not wait, do not wait, do not wait!
For futures, while most everyone is of the mind that manipulation is showing a steady hand in PMs markets, that "hand" is losing its grip. It is the charts that show what the market has to say about what those who are participating are saying about their decisions. A not so simple statement, but one that says, watch developing market activity to know what is going on.
That is always our purpose.
While ongoing efforts are being made to suppress the price of PMs and discourage their purchase, mostly in futures markets, the "Discouragees," [central bankers,] have been net buyers of gold for a few years now, after having been sellers for so long, so do not go by what central bankers say, [often voiced through the puppetmeisters on daily financial "news" programs], go by what they do, only in this area. Ignore them, otherwise.
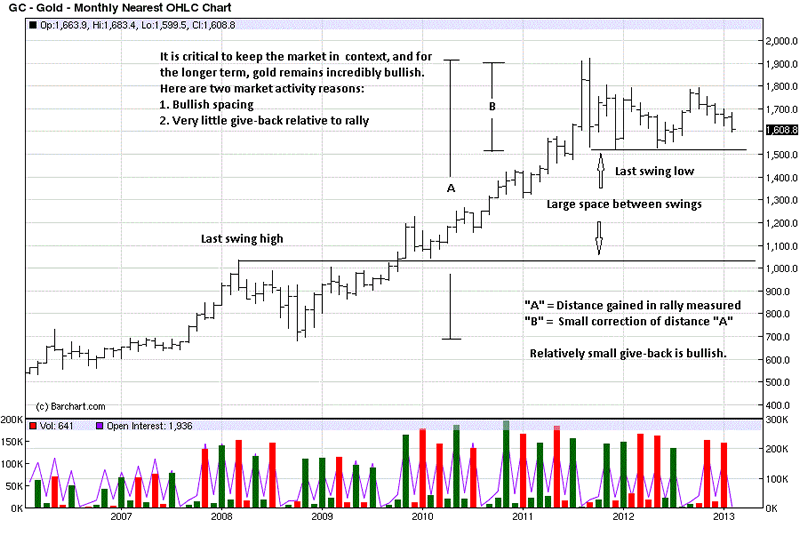
The larger picture for gold is as bullish as ever. We provide two strong facts to confirm why, on the monthly chart. Bullish spacing is referenced as such because it shows the degree of eagerness of buyers in a market. It is measured by noting the last swing high and the last swing low. Typically, markets retest previous swing highs. When buyers are so intent on being long in a market, they do not wait to see if a retest of the last swing high will be successful. Instead, they, [and by "they" we mean smart money participants, or controlling forces], just keep buying breaks, creating a space that is bullish.
Another and related measure is the extent of a break, or market "give-back," in a reaction after a rally. Monthly charts are more controlling than the lower time frames, so the information you can glean from them is more reliable and more pertinent. You can see how the current break since the September 2011 high has been relatively shallow when compared to from where the rally began.
Despite the "daily grind lower," recently, the larger focus is very strong. Very strong.
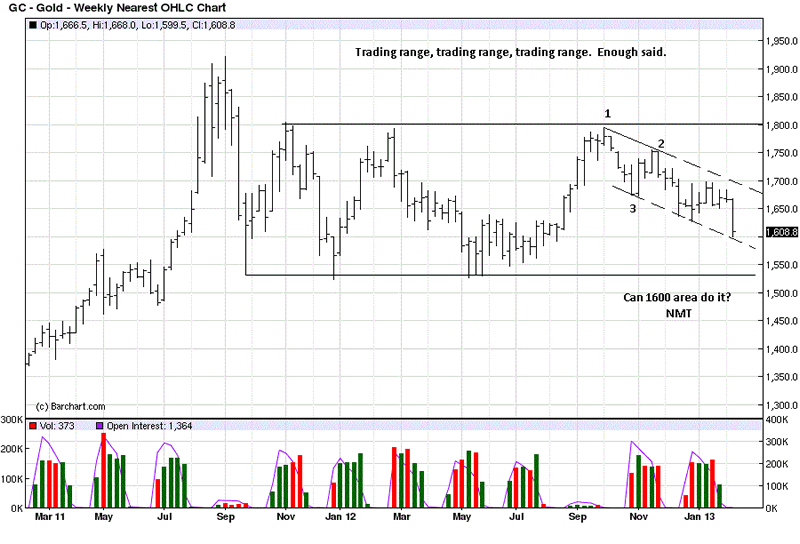
A trading range is where smart money operates to accumulate or distribute their positions. Controlling market forces require time to acquire positions so as not to disrupt their attempted "sleight of hand" buys/sells during the process, and the TRs are also used to discourage participants from following them.
We said last week that $1600 was a possible target, and it was reached on Friday. Will that area hold? "NMT." Need More Time to know that answer.
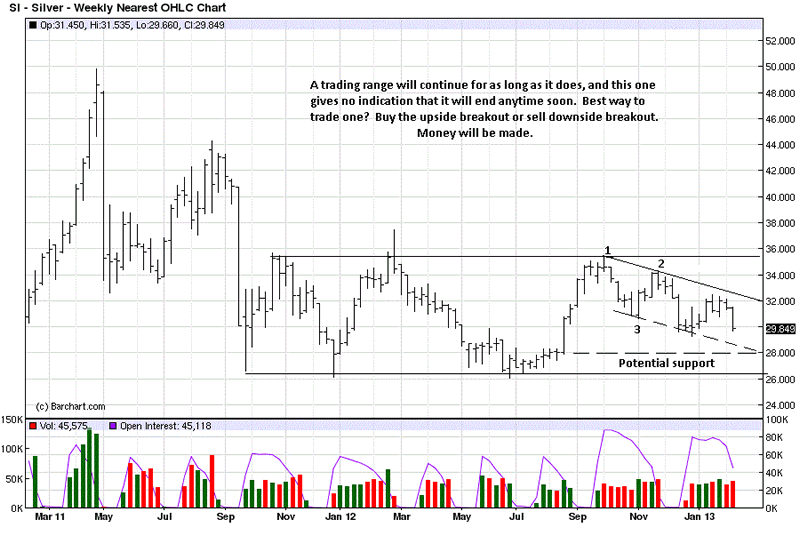
Points 1 and 2 form an upper supply channel line, and a further line down is marked by dashes to show how it extends into the future, well ahead of price activity. Point 3 is the low is between points 1 and 2, and it is from there that a horizontal line, a demand line, is extended lower. It is also dashed to show that it extends into the future well ahead of developing price activity, to be used as a guide to gauge potential support when touched by yet to develop market declines.
You can see how the dashed line held the December lows, and now February is retesting it, again. There is no evidence yet of a turnaround, and it does take time for a market to turn.
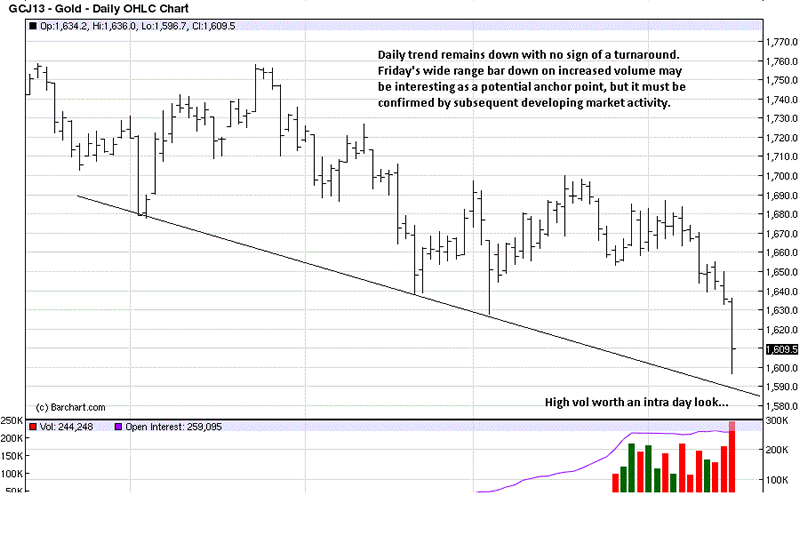
The most interesting aspect of the daily chart happens to be the last bar, Friday's activity. It is a wide range bar lower, a sign of EDM, [Ease of Downward Movement], indicating sellers are in control. The sharply higher volume is a red flag, a point in time for which one needs to pay close attention, moving forward.
Remember, sharp volume increases are usually smart money either pushing a market even more, or starting to take the other side in a transfer of risk. Subsequent developing market activity usually indicates which. This volume day prompted a look at intra day behavior to see if any clues can be gleaned.
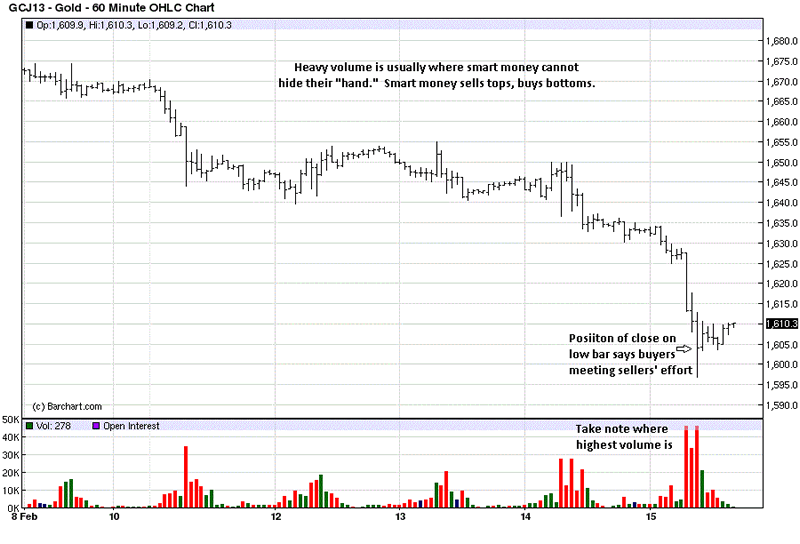
We say smart money always tries to hide their intent, but volume is something they need in order to move or accumulate positions, and they cannot hide that. If smart money sells highs and buys lows, where is the highest volume in this chart? We ask, the chart answers.
The position of the close tells us buyers are more than matching the effort of sellers to cause a rally off the low under such heavy selling pressure. The two preceding bars of increased volume may "look" like selling, but it is quite possible that smart money has been buying on the way down, taking everything offered by weak-handed longs selling out and new shorts getting in.
If Benjamin Franklin had been a trader, he would surely have said, "Never a bottom- picker be."
Bullish spacing exists in silver, just not as strongly. We do point out how the past five months of selling effort has not been impressive, relative to the two month rally prior. It is like an Ali "Rope-A-Dope," taking all the punches from his opponent, but protecting himself so not much damage is inflicted, despite the effort against him. Eventually, he comes out stronger to defeat his now-weakened opposition.
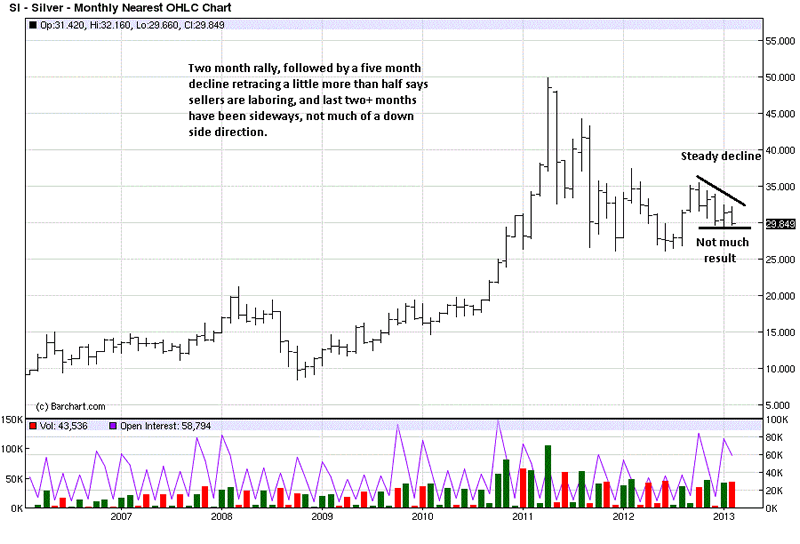
We show the same intra-TR channel down, just like in gold. Unlike gold, however, silver's low has held the lows of last December, a small show of relative strength within a negative trading environment. Still, no apparent end is at hand in the decline of futures.
The best way to trade a TR? Not to trade it at all, instead, wait for a price breakout and go with it. Why does that work? As mentioned, TRs are how smart money accumulates positions. Once they are done, they then begin the mark-up or mark-down phase, and it will last for some time, once it gets underway.
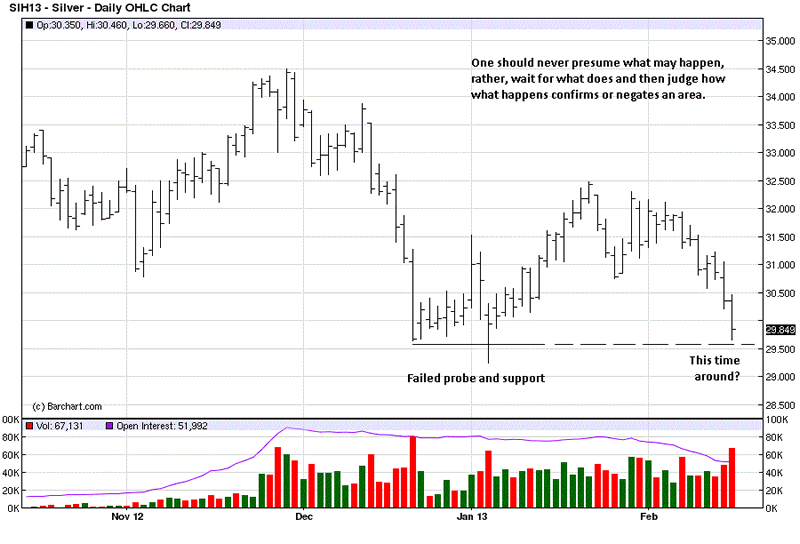
Just as a dashed line in a channel projects into the future for support/resistance, you can see where the failed probe lower, at the end of December/beginning of January acted as support. From there, a horizontal line is drawn. We made it dashed to show that is was extended into the future much earlier than when current price activity has returned to it.
Will price hold current lows? No one knows, and anyone who says otherwise is showing an unwise ego trying to be "right," as opposed to being in harmony with the market. Any bottom requires time in order to turn around, and any potential turnaround always needs to be confirmed by price behavior.
The increased volume on Friday is a red flag, as it was for gold, but a red flag means a sign or caution, to take note and see how price responds to it. That takes time. Futures players have time, or at least the smart ones are exercising it.
By Michael Noonan
Michael Noonan, mn@edgetraderplus.com, is a Chicago-based trader with over 30 years in the business. His sole approach to analysis is derived from developing market pattern behavior, found in the form of Price, Volume, and Time, and it is generated from the best source possible, the market itself.
© 2013 Copyright Michael Noonan - All Rights Reserved Disclaimer: The above is a matter of opinion provided for general information purposes only and is not intended as investment advice. Information and analysis above are derived from sources and utilising methods believed to be reliable, but we cannot accept responsibility for any losses you may incur as a result of this analysis. Individuals should consult with their personal financial advisors.
Michael Noonan Archive |
© 2005-2022 http://www.MarketOracle.co.uk - The Market Oracle is a FREE Daily Financial Markets Analysis & Forecasting online publication.


