


Embrace Silver Price Volatility All the Way to the Bank
Commodities / Gold and Silver 2013 Feb 20, 2013 - 10:30 AM GMTBy: Jeff_Clark

 Most precious-metals investors know that silver is more volatile than gold. But do they know just how big that difference really is?
We thought it would be interesting to measure how much greater silver's daily moves are – both in gains and declines – than gold.
We documented the daily price movements for both metals, and then calculated the difference using absolute values. To interpret the charts below, you need to know that:
- Values above zero represent days when silver had a greater percentage move than gold, as depicted in gray.
- Values below zero are days when gold moved more than silver, as depicted in orange.
- The values don't tell us the direction of price movements, only how much they differed between each other on any given day.
- The darker horizontal lines represent the moving average of the price differences for each metal.
With that in mind, here are the differences in daily price movements between silver and gold, measured in percentage points.
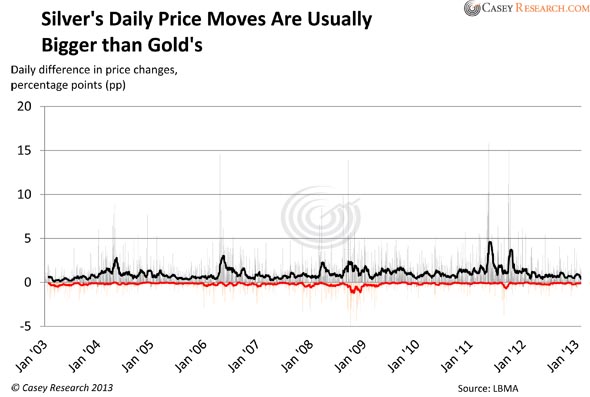
The chart is very busy, but it clearly shows that silver's daily price movements, more often than not, have been greater than gold's. In fact, from January 2003 through last week, silver's movements were larger 71.5% of the time. Regardless of the direction of precious metals on any given day, silver had a greater percentage move than gold roughly three out of four days.
Further, you'll notice that the magnitude of silver's movement have been much greater, too. On average, silver's price movements exceeded gold's by 1.3 percentage points, while on days gold had the bigger move the average was 0.81 percentage points. The moving averages easily show this.
Here are some of the more extreme examples. On May 12, 2011 (silver's biggest spike in the chart), gold rose 1.23% – but silver soared 17.05%. The day gold had the biggest percentage move more than silver occurred on December 2, 2008; gold rose 0.26% to silver's 5.05% decline.
So, is this greater volatility in silver normal? And what might we expect when the Mania Phase of this bull cycle kicks in?
The following chart maps the daily difference in price movement between gold and silver from January 1971 through December 1980.
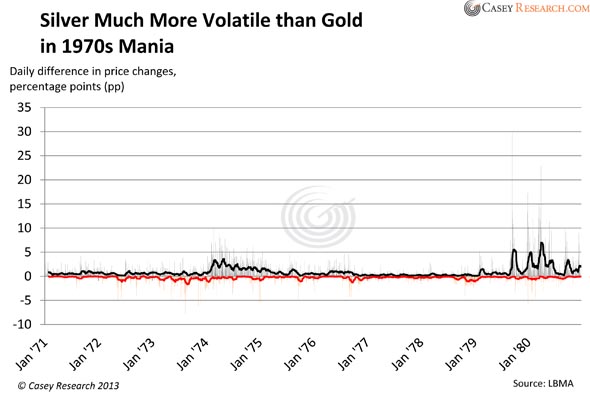
In the last big precious-metals mania, silver also logged bigger one-day movements than gold, in this case 63.5% of the time. On average, silver gained or lost 1.41 percentage points more than gold. When gold outperformed silver, roughly one-third of the time, the average percentage-point difference was 0.81.
You'll notice another interesting point. When the market entered the Mania Phase, silver's bigger one-day movements over gold's grew even bigger. During the 1979-1980 period, silver outperformed gold by an average of 2.46 percentage points, almost double what it did before the mania. In contrast, gold's average remained the same during the entire decade – 0.81.
Some of the more extreme examples include September 18, 1979, where gold rose by 6.82% and silver soared 36.59%; and March 27, 1980, where gold fell 4.38% and silver dropped 18.58%.
What Are the Implications for Investors?
 On average, silver rises higher and falls further than gold. This is true as much today as it was in the 1970s. The difference has reached as much as 15 percentage points during this cycle, while it hit 30 during the last mania. This means that investors:
- Must be able to stomach the bigger moves, regardless of the direction. If you have a tendency to get emotional about your investments, you may want to reduce your exposure to silver.
- Have an opportunity to get better prices on silver than gold. If you buy during the downdrafts, you will likely reap a bigger percentage gain than gold, as history has shown.
The historical record tells us that when we enter the mania, silver's volatility will increase. If we have a similar period as in 1979-'80, we can reasonably expect volatility to double over current levels. This will be the result of more investors joining the precious-metals industry. The moves will, on some days, be breathtaking. So again, one must be prepared emotionally to handle the volatility, as well as be more nimble when it comes to buying and selling.
Since current volatility is roughly half what it was during the last mania, we have yet another piece of evidence that indicates we're not in a bubble. Yet. Ignore those who claim otherwise; you still have time to enter this market.
It also means that when silver resumes its uptrend, the producers will outpace the metal by a wide margin. The "snapback" in silver stocks should be tremendous – but not every company will benefit equally, as not all producers have the same profit potential, political exposure, management prowess, and growth prospects.
There's a little-known anomaly in the precious-metals market that key institutional investors are using to buy deeply discounted gold. But you don't have to be big-time investment firm to take advantage of it. Details here.
© 2013 Copyright Casey Research - All Rights Reserved
Disclaimer: The above is a matter of opinion provided for general information purposes only and is not intended as investment advice. Information and analysis above are derived from sources and utilising methods believed to be reliable, but we cannot accept responsibility for any losses you may incur as a result of this analysis. Individuals should consult with their personal financial advisors.
Casey Research Archive |
© 2005-2022 http://www.MarketOracle.co.uk - The Market Oracle is a FREE Daily Financial Markets Analysis & Forecasting online publication.