


Copper – Huge Sell-Off. Who Is Doing The Buying?
Commodities / Copper Feb 24, 2013 - 04:15 PM GMTBy: Michael_Noonan

 Market activity rules! It is the basis for understanding the motivation for all moves, up or down. If you want to know what smart money [controlling influences] is doing, watch when volume activity picks up, especially at highs and lows for that is when a transfer of risk from weak into strong hands occurs.
You do not have to pay attention to news, what others are saying about the market. You get far more accurate, and current information on where the market is headed by reading what the market is saying about others. This comes in the form of price/volume behavior. Smart money is very deft at hiding their hand. They move much larger positions, so it is during high volume activity when one can best determine when they are active, and what they may be doing.
One thing known about the markets is that the public does not generate high volume. They respond to it. The driving force behind sharp volume increases comes from controlling influences, what we call "smart money." Another thing known about markets is that they never lie. All they do is generate information available for everyone to read at the same time. Charts provide the proverbial pictures worth more money than words, particularly when they reveal important knowledge.
Last week we posted our article, Copper - Poised For A Breakout. The market broke down, instead. We always go with the developing market activity known at the time. Change can only come when there is an unexpected change in market information. On the day when expectations were for an upside breakout, the market did the opposite, a very powerful message. It can be difficult to adjust to abrupt market moves, but that is what stops are for.
Were we wrong in the analysis? Absolutely, and not for the first time. It is okay to be wrong. The most important part is not to be wrong for long. Just move on to the next trade because profitable opportunities are always coming along. We deal in markets, not egos.
[A Commentary was posted: Copper - When Trade Recommendations Do Not Work, click on http://bit.ly/15bSPXf, on 19 February 2013]
It is newly developing market information that either confirms or negates one's position. To succeed in trading, one must always be flexible and go with the will of the market and not the will of the ego. What was is past tense and will not change. To survive, one must move forward and change with the market.
The monthly chart is from our last article, with an added comment. Anything can happen.
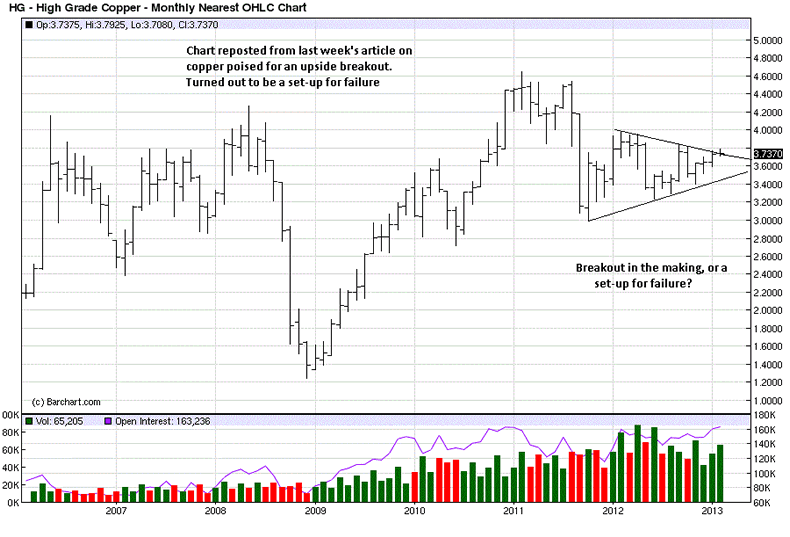
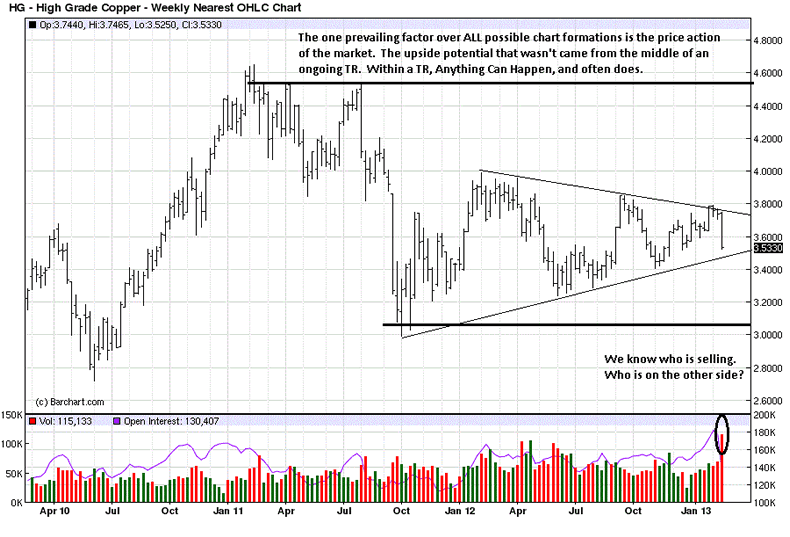
A valuable lesson to learn about the markets is that the factual activity, in the form of various bar ranges, from small to large, with accompanying volume, from low to high, and so much in between; these known market facts take precedence over any and all formations imposed on the chart structure. A triangle, a wedge, a trend line? They can be helpful as guides, but the bar/volume structure is supreme.
We never use mechanical tools, like moving averages, RSI, Bollinger Bands, MACD, etc. They work, occasionally, as does a stopped clock: deadly accurate twice a day. They are past tense-derived market activity imposed upon the present tense, and the two are often not related, except in the user's mind that "sees" a relationship.
The most important information on the weekly chart is the high volume from last week. A lot of longs were liquidating, and losses mounted for those late in acting. The question not enough ask is, "Who was on the other side,doing all the buying?"
As an aside and pertinent to our non-use of mechanical tools, how helpful were they in last week's dramatic change? Rely upon past tense tools at peril, from our perspective.
This daily chart shows total, [combined contracts] volume. We wanted to know if there were any distinction in that and the lead month contract, just in case.
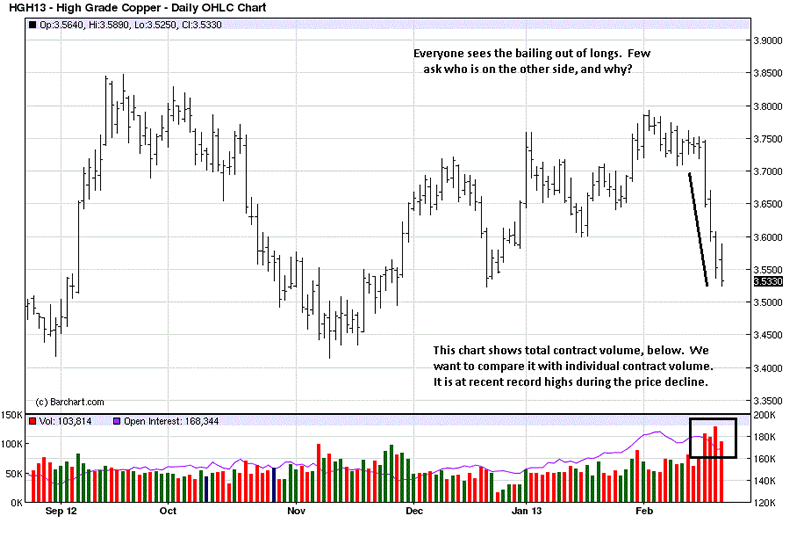
There were none.
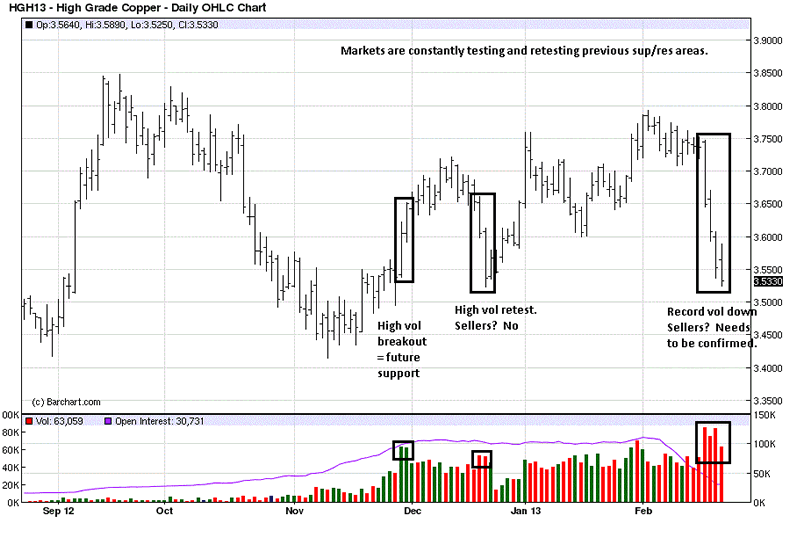
If you go back to the above chart, where does your eye go? Almost all look at the most recent activity. There are no accidents in market activity. Everything happens for a reason. The history behind present tense price activity provides important information, guideposts, if you will.
Nature abhors a vacuum, as do the markets. Past tense relates to present tense when the present tense relates to past tense. Take it as a circular statement, but it has meaning. A down trend in daily copper changed at the end of November. What do you see? Two very wide bars up with strong closes and increased volume. This is the kind of activity that gets retested, all the time.
There is a sell-off in mid-December with the opposite activity. Two wide range bars down with weak closes and increased volume. Typically, this action tells us sellers are in control. It looks like weak hands were bailing out and some stops were being hit. Where was the downside follow-through?
Price did violate support, but it rallied to a higher high. Who was doing the buying when so many were selling? We say smart money, based on factual market information. What needs to be known about smart money is they sell high and buy low. If smart money were doing the selling in mid-December, the increased volume would have appeared several trading days earlier, at the swing high.
Taking past tense activity and applying it to present tense, we look at last week's action. The 22 cent decline occurred on record contract volume. Who was doing the selling? Longs, established at higher levels earlier in the month, and even from January, when those positions were still profitable up until last week's high. Weak hands were getting out, many apparently not soon enough. [Always use stops.]
Where is the bulk of the volume? On the way down and at the lows. Ask a few logical questions: Would that be smart money deciding to sell on the way down and at the current low? Or would controlling influences be buying, a transfer from weak hands into strong?
Patterns appear in the markets all the time, over and over, slightly different in detail, but similar overall. The pattern of last week's decline is not unlike the pattern from December. The intensity is much greater, currently, but it is a repeat, not only from two months ago, but from similar patterns in many other markets, exhibiting the same qualities of market behavior, the human element of trading that has not changed over hundreds of years.
If you look at the last bar on the chart, it overlaps the previous one. Overlapping bars indicates a struggle between buyers and sellers. This says buyers were meeting the efforts of sellers, at the lows, not overcoming them, but slowing the selling. That is confirmed by the small net gain lower from the previous higher volume down day. The lower volume, Friday, also says selling pressure abated. Small signs, but signs nonetheless.
That same previous higher down day, second bar from the end, was the second highest volume and the smallest range down of the three from the high. The market is giving us information. When increased volume results in a smaller range, it is because buyers, in this instance, were meeting the efforts of seller and stopping the range from extending lower. These little market messages begin to add up. There was both smart money buying and short-covering on the way down. That is who is on the other side.
It takes time to repair damage, and smart money will punish those who impatiently get in their way. Let the market settle down, and then look for confirming signs that a low has been established. Why wait for confirmation? Price can still go lower. Never forget: Anything Can Happen, and often does when you least expect it.
The opening to this article was: "Market activity rules!" For a reason. Never ignore it.
By Michael Noonan
Michael Noonan, mn@edgetraderplus.com, is a Chicago-based trader with over 30 years in the business. His sole approach to analysis is derived from developing market pattern behavior, found in the form of Price, Volume, and Time, and it is generated from the best source possible, the market itself.
© 2013 Copyright Michael Noonan - All Rights Reserved Disclaimer: The above is a matter of opinion provided for general information purposes only and is not intended as investment advice. Information and analysis above are derived from sources and utilising methods believed to be reliable, but we cannot accept responsibility for any losses you may incur as a result of this analysis. Individuals should consult with their personal financial advisors.
Michael Noonan Archive |
© 2005-2022 http://www.MarketOracle.co.uk - The Market Oracle is a FREE Daily Financial Markets Analysis & Forecasting online publication.