Gold Set for Next Major Uptrend to Break to New All Time Highs
Commodities / Gold and Silver 2013 Mar 03, 2013 - 05:49 PM GMTBy: Clive_Maund
 COTs, sentiment and public opinion and a raft of technical indicators are all at low extremes that continue to indicate that gold is marking out a major low here and set to reverse to the upside before long. So you can safely ignore all the fair weather pundits who are coming out of the woodwork to proclaim gold's bullmarket dead, and also the plethora of bearish articles appearing in the mainstream media at Big Money's behest in order to squeeze the last drop of blood out of the little guy before the next big rally starts.
Last week's update was probably the most bullish we ever produced, and the picture hasn't changed much since, except that the dollar and Treasuries have broken out upside, but for reasons that we will come to later this won't stop gold reversing to the upside, and public opinion has become even more negative, which of course is bullish.
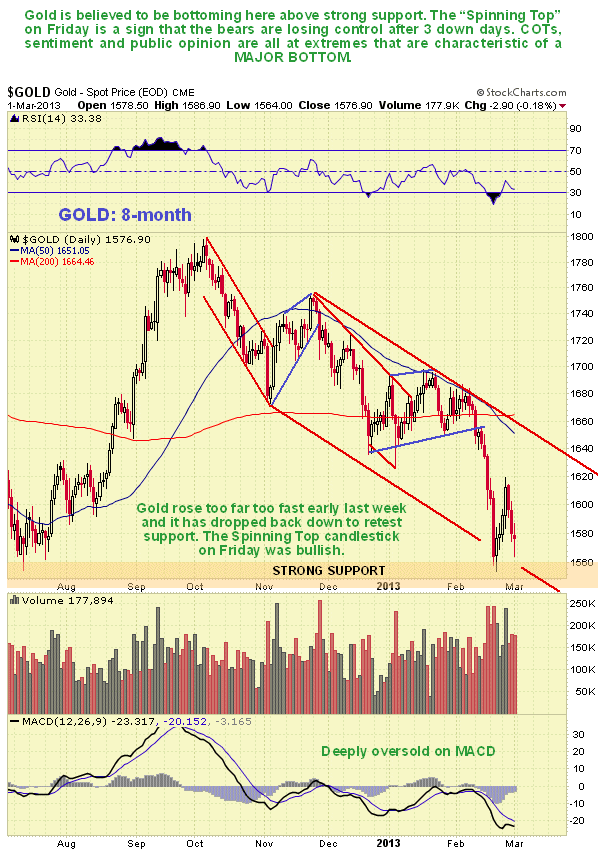
On gold's 8-month chart we can see that the 4-day rally into last Tuesday's close resulted in it rising too far too fast, given its prior downtrend. This was the reason it dropped back down during the rest of the week for a retest of support. However, bears started to lose control on Friday, evidenced by a 'spinning top' candlestick appearing on the chart. When such a candlestick appears on a chart after a drop, it frequently portends a rally. As we can see gold is still deeply oversold on its MACD indicator and very near the bottom of an intermediate downtrend channel.
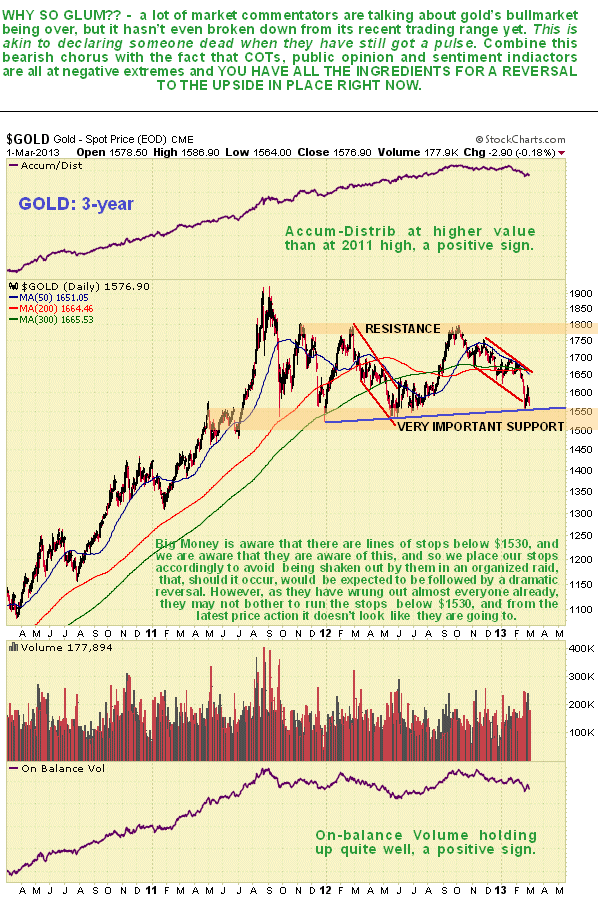
It is interesting to observe a lot of commentators becoming bearish on gold over the past week or two, especially given that it hasn't even crashed important support and is still in a large trading range. This is just what we want to see before a major rally, since many advisors get caught up in the same gloomy mindset as their clients. We can see that gold still looks alright on its 3-year chart, which simply shows that it is near the bottom of a large trading range after its recent drop. Moving averages are still reasonably well aligned, and the current bunching of its moving averages is what frequently precedes a major rally. In addition volume and volume indicators are still overall positive relative to price, and certainly not negative. One thing that traders should be aware of is that because support at the bottom of this large trading range is so clearly and sharply defined, it is very likely that a large number of stops are clustered just below it, which makes it tempting for Big Money to engineer a false break below this support to run the remaining stalwarts out of their positions ahead of a swift reversal and big rally. They may not bother though because they have already succeeded in squeezing most players out, as the indicators we will come to shortly make plain. Nevertheless it is worth taking this into consideration when deciding where to place stops.
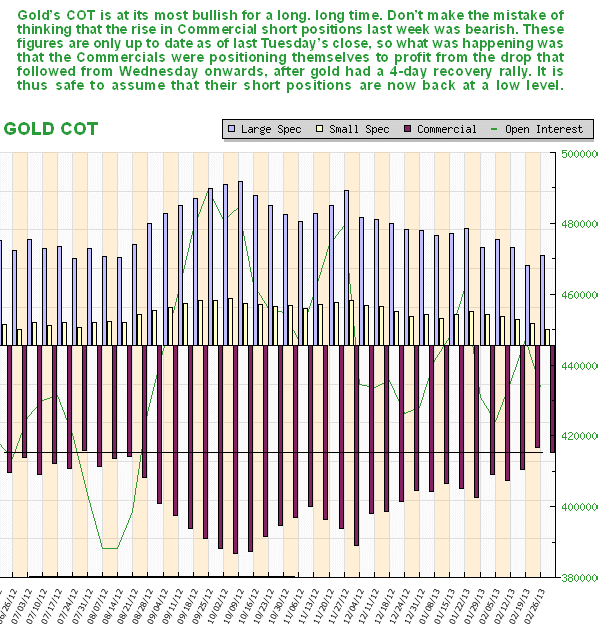
COTs are little changed from last week and still strongly bullish. There was a slight rise in Commercial short positions, but remember this data is of last Tuesday's close, so this increase was just the Commercials positioning themselves to profit from the 3-day drop that then ensued. It is thus safe to assume that they scaled back their shorts on Friday. Jim Sinclair recently remarked that the COT data may be or is being rigged. We can only comment that so far it has worked well for us, although we are aware that they could set about rigging the COT data, like so much else, if they so decide, although the fact of the matter is that thus far most traders are too lazy and/or stupid to use it, so they probably don't need to bother. Long may this situation continue!
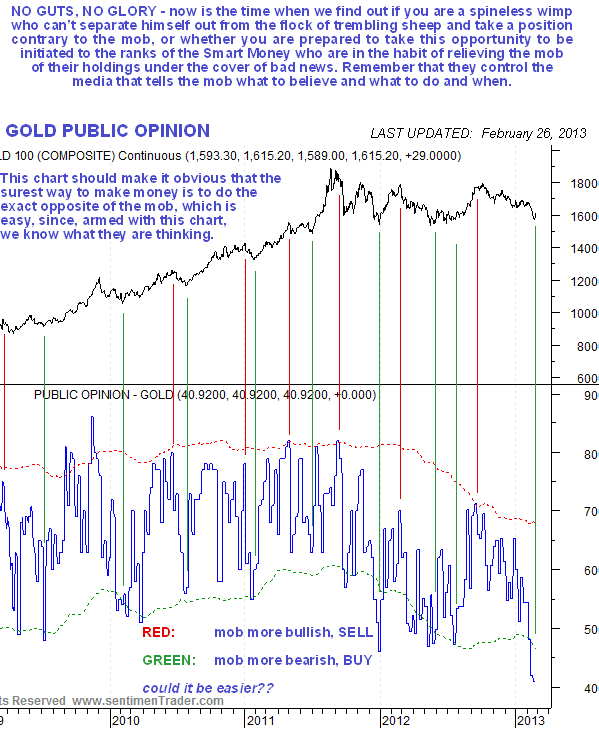
The gold public opinion chart is an absolute dream for gold longs, or new longs. As we can see on this chart the sheep now hold gold in the lowest esteem for years. You can see how routinely wrong the crowd are on gold just by following the red and green lines we have drawn on this chart. They seem to know their place in the system - their job is to work hard, and when they eventually manage to accumulate some capital, turn round and give it to wealthy people, preferably gift wrapped. Anyway, the current reading is viewed as VERY STRONGLY BULLISH.
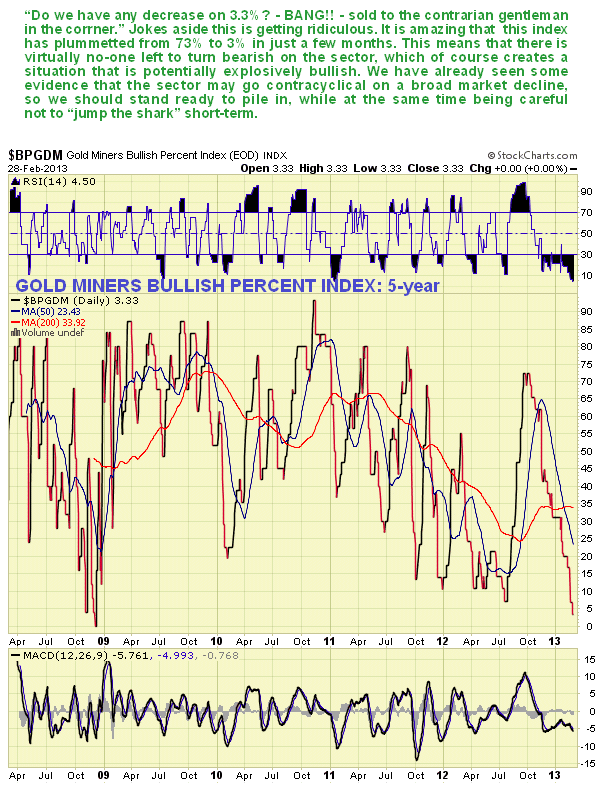
Another indication of a bottom for the sector is the abysmally low reading of the Gold Miners Bullish % Index, which at 3.3% is currently only a shade above its 2008 crash lows. It is astounding that this index has dropped from 73% to 3.3% in just a few months. What is clearly shows is that there is virtually no-one left to turn bearish on the sector, which means it is unlikely that it will drop much more, and the other side of the coin is that the moment buyers do show up in any numbers, it is likely to generate an explosive rally.
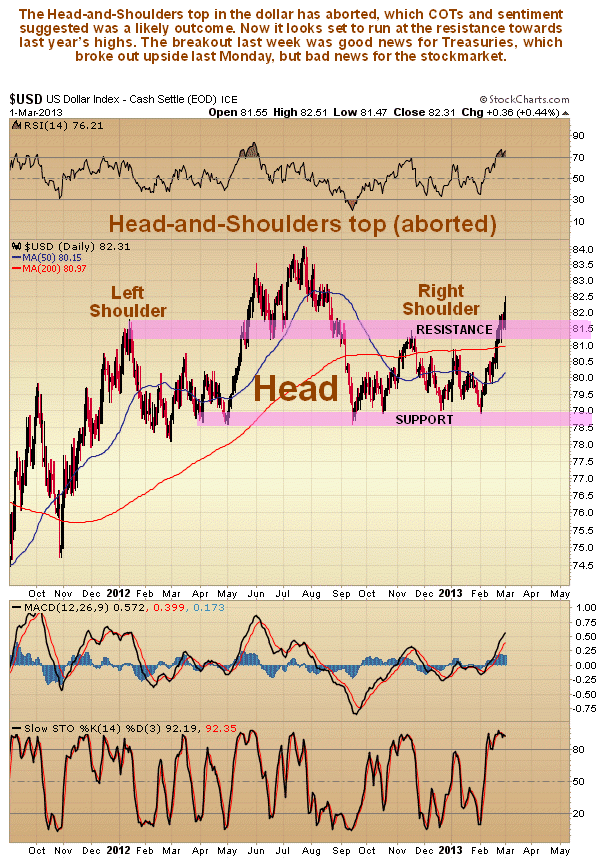
What about the dollar and Treasuries? Many gold and silver bulls needed to change their trousers after both the dollar and Treasuries staged breakouts last week. We had thought that there was a good chance of the dollar breaking out upside for some time, and for sure predicted the Treasury breakout, all based on recent COTs and sentiment. The fundamental reason for this development is the renewed crisis in Europe resulting from the indecisive election result in Italy, which foiled the elites' plan, temporarily at least, to push the bill for the mess that they created onto the ordinary populace via draconian austerity measures. The Italian people are sufficiently fed up that they decided that they would rather be ruled by either a comedian or a philanderer, or both, than by a grey banker, and it has to be said that Berlusconi has a lot more charm than, say, The Godfather. However, it may be going too far to assume that this will lead to another 2008 style market implosion - if they can succeed in somehow papering over the cracks and keeping things limping along, then the dollar and Treasury rally may have a limited life. If the rally does continue to considerably higher levels it would probably trigger a severe decline in the stockmarket, and this time, unlike in 2008, the Precious Metals sector is likely to go contra-cyclical, which it is certainly entitled to since it has already been in contra-cyclical mode for months, but regardless of these considerations, all the indicators that we have considered above are flashing that gold is set to take off soon on a major uptrend.
On the dollar index 18-month chart we can see that, having succeeded in aborting its Head-and-Shoulders top by breaking out above the Left Shoulder high, it now looks set to rally at least to the high of the Head of that pattern at about 84, where there is resistance. The dollar's current good fortune is due to the euro's current misfortune, and certainly not due to the actions of the Fed, which has been working assiduously to undermine it for years. The dollar's short and medium-term oscillators are actually getting substantially overbought already, so the 84 area would be a good point to this rally to end, and it is now not so far above the current level.
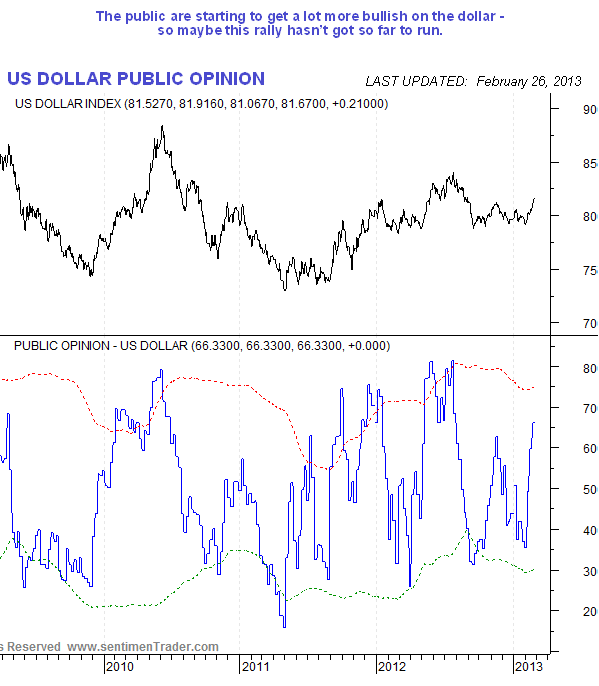
Public opinion on the dollar has improved dramatically over the past couple of weeks to the point where it is approaching getting excessively positive.
The conclusion to all this is that, regardless of what the dollar and Treasuries do, gold is believed to have bottomed or to be very close to doing so, and to be readying for its next major uptrend that should break it out of its large trading range and take it comfortably to new highs.
By Clive Maund
CliveMaund.com
For billing & subscription questions: subscriptions@clivemaund.com
© 2013 Clive Maund - The above represents the opinion and analysis of Mr. Maund, based on data available to him, at the time of writing. Mr. Maunds opinions are his own, and are not a recommendation or an offer to buy or sell securities. No responsibility can be accepted for losses that may result as a consequence of trading on the basis of this analysis.
Mr. Maund is an independent analyst who receives no compensation of any kind from any groups, individuals or corporations mentioned in his reports. As trading and investing in any financial markets may involve serious risk of loss, Mr. Maund recommends that you consult with a qualified investment advisor, one licensed by appropriate regulatory agencies in your legal jurisdiction and do your own due diligence and research when making any kind of a transaction with financial ramifications.
Clive Maund Archive |
© 2005-2022 http://www.MarketOracle.co.uk - The Market Oracle is a FREE Daily Financial Markets Analysis & Forecasting online publication.


