


U.S. Housing Real Estate Market House Prices Trend Forecast 2013 to 2016
News_Letter / US Housing Mar 04, 2013 - 12:28 PM GMTBy: NewsLetter
 The Market Oracle Newsletter
Janaury 12th , 2013 Issue # 1 Vol. 7
U.S. Housing Real Estate Market House Prices Trend Forecast 2013 to 2016
Interest Rate Mega-Trend Ebook Direct Download Link (PDF 2.3m/b) Inflation Mega-Trend Ebook Direct Download Link (PDF 3.2m/b) Dear Reader Following the peak of the over leveraged US housing market bubble late 2006, the real estate market literally crashed during 2007 triggering the financial crisis that has acted to subsequently feed a multi-year bear market as a consequence of the subprime mortgage debacle that was magnified globally via toxic CDO packages that literally risked the bankruptcy of the whole global financial system starting in June 2007 when Bear Sterns bailed out one of its hedge funds, within a year Bear Sterns would effectively go bust as JPM picked it up for about 5% of its peak value that acted as a prelude to what was yet to come during 2008 for the likes of Lehman's that prompted tax payer bailouts right across the globe to prevent financial armageddon as the too big to fail banks only slowly revealed the extent to their exposure to the toxic mortgage backed securities in what amounted to the greatest fraud in history as investors had been duped into buying junk that the credit rating agencies typically rated as Triple A for a fee.
However, one of the best times to invest in an asset class is when it is at it's most hated, i.e. after a crash and a prolonged bear market when most investors have been badly burnt by losses, the US housing market and many other global housing markets such as the UK fit the bill for the potential for being at such an opportune moment during 2012 due to similar money printing asset price inflating government policies as I have been flagging for most of 2012 for expectations of the UK and US specifically to have entered into embryonic bull markets that this analysis seeks to expand into a detailed multi-year trend forecast. 06 Sep 2012 - Super Mario Draghi Triggers Stocks Stealth Bull Market Rallies to New Bull Market Highs This years convergence towards housing market bottoms such as the UK and US presenting one of those once in a couple of decades opportunities to climb aboard what still are embryonic bull markets, just as I strongly suggested the birth of a new multi-year stocks stealth bull market in March 2009 Revisiting US Housing Market Forecast 2008-2010 It has been four long years since I last analysed the US housing market due to lack of personal exposure to this market. My last forecast (29 Jun 2008 - US House Prices Forecast 2008-2010) concluded in a forecasts for a continuing bear market for another 2.5 years into the end of 2010 as illustrated by the below original graph -
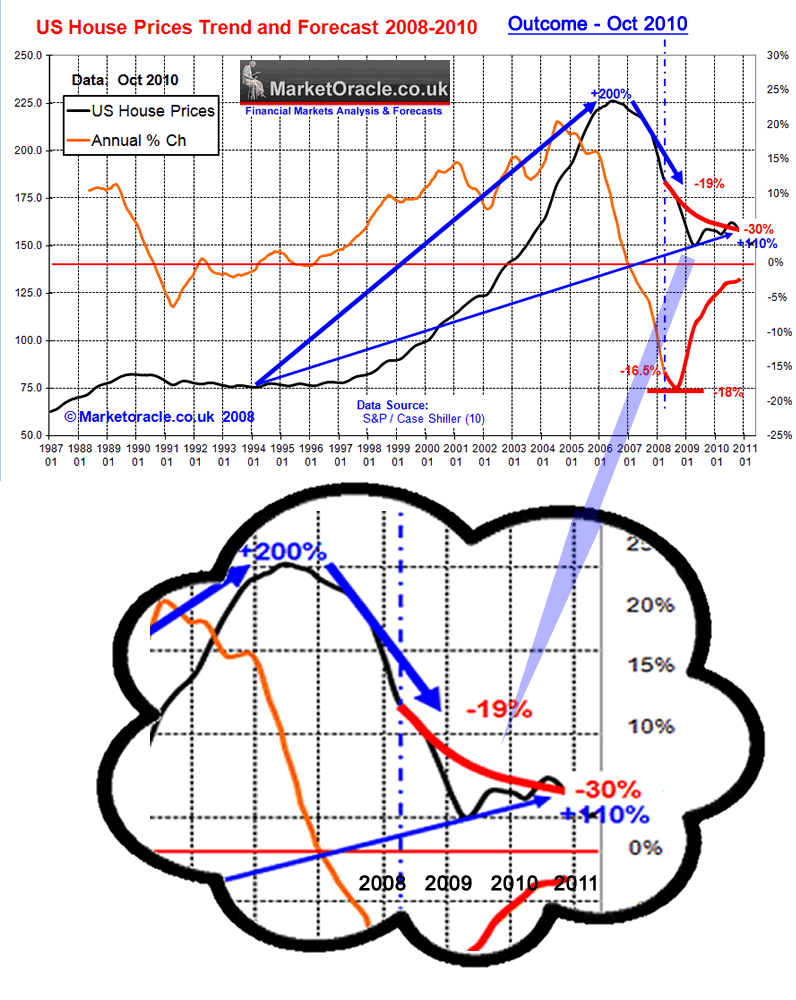
US House Prices Forecast Summary - Nominal US House Prices are forecast to fall by 30% from the Mid 2006 peak by the end of 2010, or a further 11% on the decline of 19% to date. US house prices will continue falling in real-terms even if a low in nominal house prices is made by mid 2010. Actual outcome - The forecast for the Case shiller index to fall from 181.5 down to 158.7 over the subsequent 2.5 years, compares against the actual October 2010 index of 157.50, which virtually matches forecast expectations. Whilst the actual trend was more severe with the original support trendline containing the decline and subsequent uptrend.
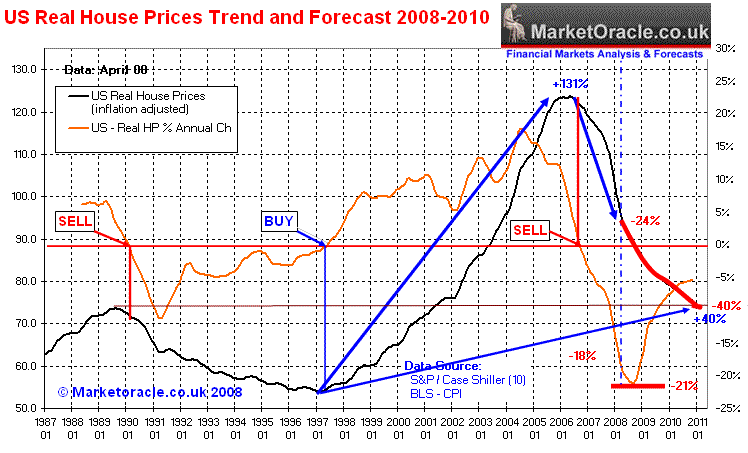
The analysis of June 2008 also gave the conditions for when a buy trigger would be initiated that had it's basis in the prevailing Inflation Mega-trend i.e. in terms of when US house prices would start to rise in real terms, and concluded that that no such a buy trigger was likely to occur during the following 2.5 years (into the end 2010) -
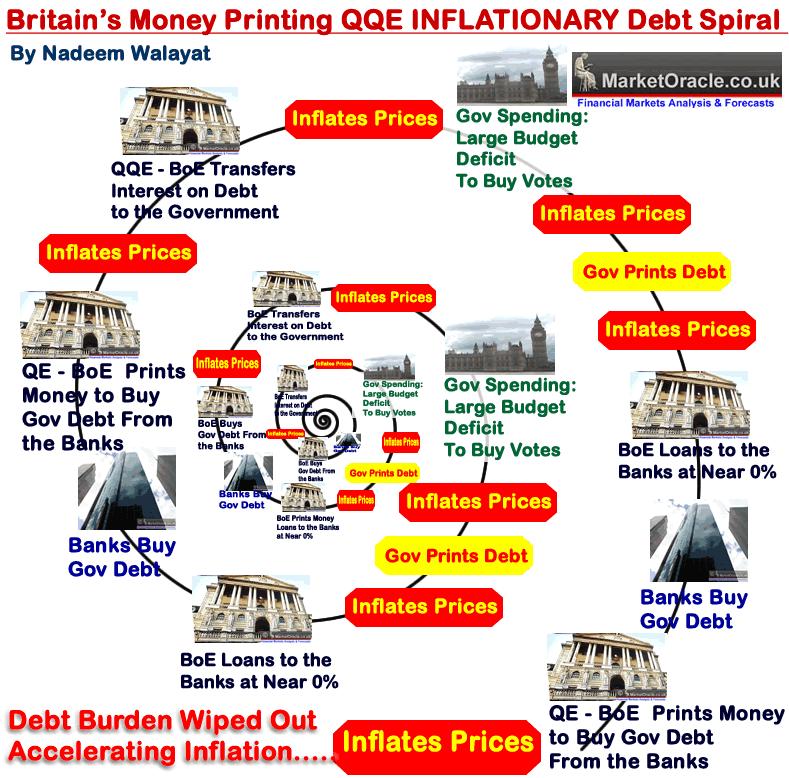
When to Buy? - The time to start contemplating buying real estate again will be after the US housing market has made a nominal bottom in house prices and at the time US house prices start to increase in real-terms as the BUY / SELL signals above illustrate. As per this analysis there is no sign of a BUY trigger occurring within the next 2 1/2 years. Money Printing QE-4-EVER The US Fed's latest efforts to put a floor under the U.S. housing market so that the banks stop being bankrupt, QE3 which started at $40 billion per month as an escalation of the policy for the transference of bad loans / defective mortgages from the bankers and onto the tax payers by way of the electronic money printing presses. This was added to in December 2012 by the Fed announcing it would also buy £45 billion of US Treasury bonds per month as it monetize's / effectively cancels US debt in a similar manner to that which the UK is engaged in as illustrated by the below graphic (Bank of England Cancels Britain's Debt)
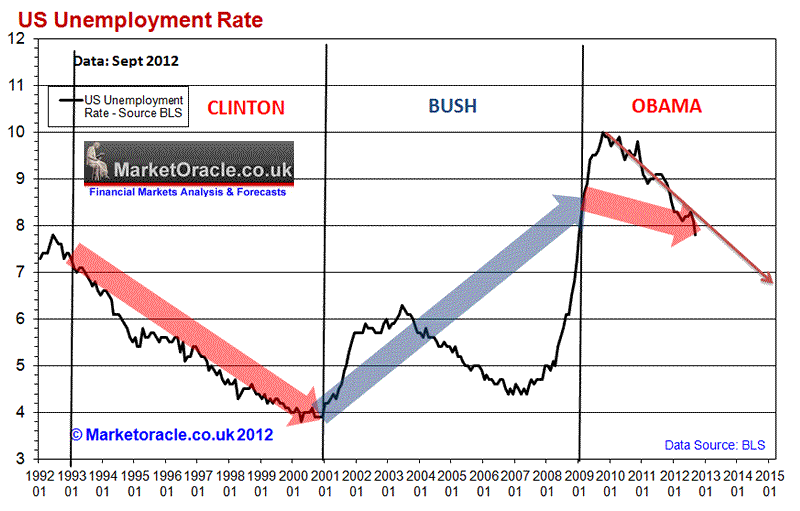
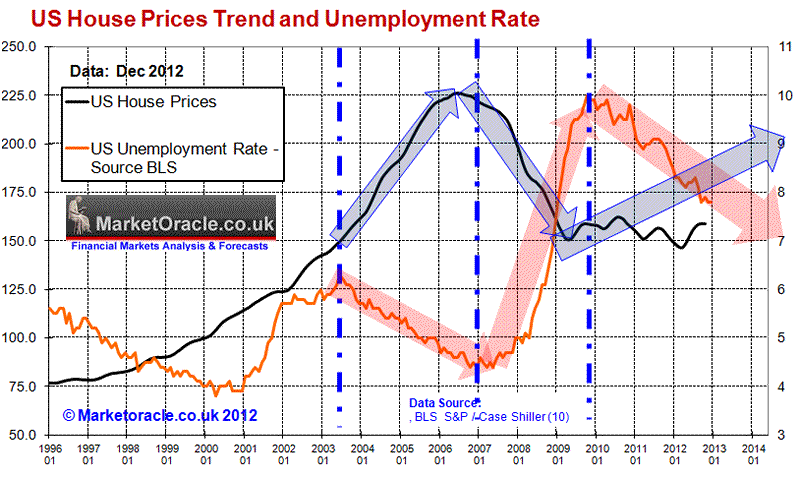
Briefly, QQE amounts to the Fed returning the interest received on the US Treasury Bond it holds back to the US Treasury, which effectively means that debt has been cancelled (effectively, not actually) and therefore the US over time will have an effective falling Debt to GDP ratio whilst the actual Debt to GDP Ratio suggests otherwise. This is what I termed 6 months ago as the Quantum of Quantitative Easing the price for which is INFLATION as the Fed is effectively funding virtually the whole US budget deficit by printing money for nothing. Many commentators in the mainstream press such as in the FT stated that QE3 it is deemed to fail, and others question how can this spark an housing bull market. However, academics and journalists, who are not exposed to market forces fail to comprehend that market trends are made at the margins, for instance the difference between a recession or economic boom is little more than 3% of GDP, which is marginal to total GDP but has a far greater impact on all aspects of life. Where the markets are concerned marginal impacts have a far greater effect on market trends because of the fact that most people are only ever aware of these tips of the Ice-Bergs, i.e. all of the statistics that tend to get bandied about are mere tips of the financial ice-berg that is the $1 Quadrillion derivatives markets ($1000 trillion), which is why the reaction of asset prices is leveraged to Inflation that is the consequences of perpetual money printing in all of its form no matter whether its called QE3, or Open Market Operations, or Loans to the banks, or government debt printing (bonds), all of these actions are Inflationary, and it is marginal changes in the Inflation rate that is leveraged by the derivatives market Ice-bergs that sets trends in motion that act to feed upon them selves all the way to the NEXT bubble stage. Therefore, before I receive a string of comments stating that x,y,z economic indicator is weak so house prices cannot possibly rise. The primary indicator to watch is Inflation because whilst we do not know to what the exact the reaction of the derivatives market will be, i.e. where the flood of money will exactly flow to, however I do know that it will be leveraged to far beyond the nominal extent implied by the annual rate of change which in itself tends to mask the exponential rate of Inflation, i.e. the official inflation rate of 2% compounds each year. All central banks understand this, which is why the Fed is specifically targeting mortgage backed securities that are leveraged many times over ny derivatives, $85 billion a month / $1 trillion per year will probably have an impact on the financial system of many times that amount. Another factor to consider is speculators from individuals to the mega- investment banks see what the Fed is doing and then attempt to discount future market action to this ongoing policy of market manipulation by the Fed, by reacting far beyond that of the nominal amount of $85 billion suggests, and it is this which sparks the change in trend that feeds on itself that this article seeks to evaluate in terms of the expectations for the US Housing market. U.S. Unemployment and House Prices Of all of the statistics a developed economies statisticians generate, the rate of unemployment is near the top of list of those that best reflect the true state of an economy which is why it factors so strongly in the politicking that goes on, in which respect both the Democrats and Republican are always busy putting their own spin on the latest U.S. unemployment data released by the BLS which shows that the US unemployment rate has held steady at 7.8% after having spent over 3.5 years above 8% and down from a high of 10% reached in October 2009. The Truth About the U.S. Unemployment Rate This analysis is sticking to the official standardised statistics produced by the BLS rather any of the political motivated statistics found around the net, the below graph illustrates the trend in the unemployment rate from 1992 to the present in terms of Presidency (06 Oct 2012 - High U.S. Unemployment Rate, Obama Failure or Bush Catastrophe for Romney to Continue?).
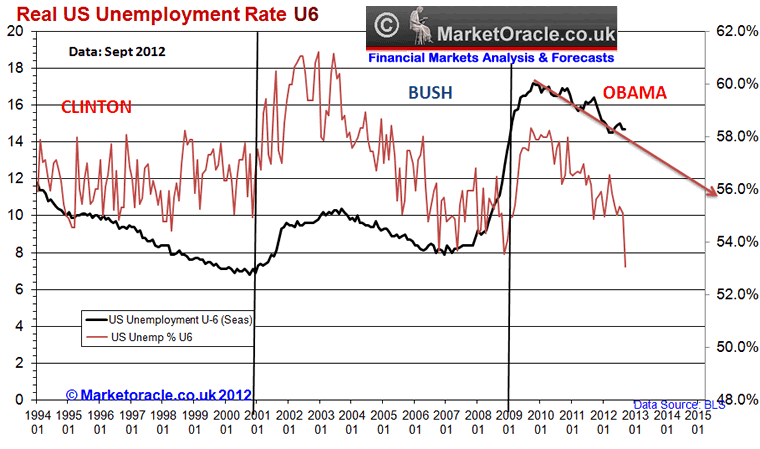
US Unemployment Rate Facts Clinton - Unemployment Rate fell from 7.2% to 4.2% - 3% Bush -Unemployment rate rose from 4.2% to 8.3% +4.1% Obama - Unemployment rate to date has fallen from 8.3% to 7.8% -0.5% The data clearly illustrates the extent to which the Bush presidency was a catastrophe for America as Bush handed Obama an economy that was literally in a state of free-fall, the consequences of which were that it took Obama some 10 months to bring the rate of free fall to a halt, with the subsequent recovery at a very similar rate of decent as that under the Clinton Presidency which suggests, should this trend continue the U.S. unemployment rate should fall to about 6.5% by the time of the 2016 election which suggests continuing Fed support. Historic Record A further look at the historic unemployment rates amongst previous Presidents shows that there is a clear tendency for Republican Presidencies to push up unemployment rates whilst Democrat Presidencies tend to cut the unemployment rates. The Truth About the Real U.S. Unemployment Rate During the election campaign many republican's such as Donald Trump were been busy pointing out that the real US unemployment rate is as much as double the official rate with figures typically offered ranging from 11% to 20%, which has some basis in fact as the actual total US unemployment rate referred to as U-6 stands at 14.7%, so many republicans are correct in claiming that the real rate of US unemployment is far higher than the official rate as the official rate only includes those that are actively seeking work. This figure does not include the unemployed who are not actively looking for work; nor does it factor in workers with part-time jobs who are seeking full-time employment. When these workers are included, the (U-6) un/underemployment rate nearly doubles to 14.7% that remains unchanged from the August figure. All Presidents tend to utilise this trick to under report the true level of official unemployment. The only way to gauge the level of corruption in the unemployment statistics is by taking a look at the official rate of unemployment relative to total rate of unemployment in percentage terms, where the lower the percentage the greater the level of corruption that tends to occur in the lead up to elections.
An analysis of the rate of corruption suggests that - a. the Bush regime during the last 3 years of it's Presidency was engaged attempting to maximise the level of corruption in the official unemployment statistics. b. That the Obama regime official statistics in the lead up to the 2012 Election increasingly became more on par with that of the Bush regimes efforts in the lead up to the November 2008 election i.e. Obama's Unemployment statistics are just as corrupt as that of President Bush. Therefore whilst the real rate of unemployment has reduced as both graphs exhibit a downtrend, the actual extent of the fall in unemployment is far less than the official statistics suggests. The reality is that the pre-election report was highly suspect, where the comparison against U6 does suggest it has been manipulated for electioneering purposes i.e. not by the BLS but via government policy to aim to mask real unemployment. Fed Targets Unemployment Rate The Fed further confirmed the expectations for a trend towards 6.5% in its December announcement that it had decided to target US unemployment rate down to 6.5%, which is a further example of the Fed escalating its response towards inflating the US housing market and economy and the central bank further taking its eye off of Inflation that will likely come back to bite the US over the coming years. What this effectively means is that the policies of Zero interest rates and money printing (QE) are set to continue until the US unemployment rate falls to or below 6.5%, which is mans for several more years. U.S. Unemployment and House Prices In the preceding analysis (as of 6th Oct 2012) we have determined whilst the long-term trend in unemployment is down and targets a rate of 6.5% by early 2016, however against this the unemployment rate is likely to experience upward pressure into mid 2013. Now firstly one needs to realise that the absolute figure is not as important as the trend as house prices are predominantly sentiment driven therefore the importance of the unemployment data is the psychological impact of rising or falling statistics have on market participants future expectations.
Key points that stand out -
The key conclusion is that US unemployment falling from 10% to 7.8% has acted to stabilise US house prices. With my expectations for US unemployment to fall to below 6.5% by 2016, this will act as an accelerant on US house prices i.e. US house prices response will be leveraged to increasingly LOWER rates of unemployment i.e. a fall from 7% to 6.5% will engender a greater response than a fall from 7.5% to 7%. Unemployment Rate Housing Market Drivers
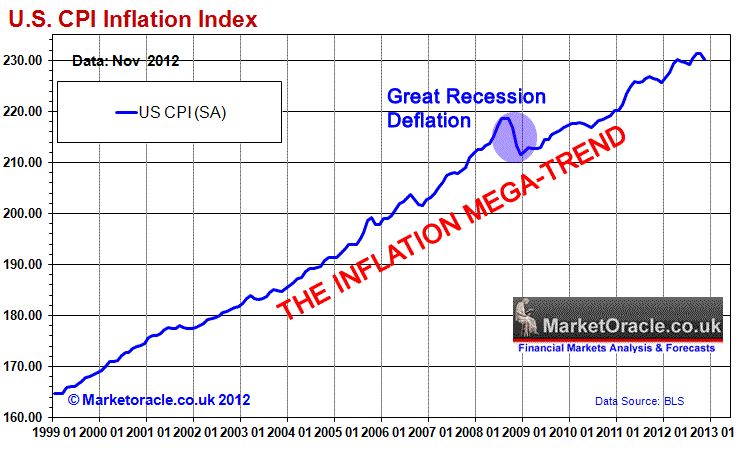
US Economy - Ignore Debt Ceiling Drama Whilst Europe, the UK and many other major developed countries have stagnated the US has continued to show relative strength by registering 3.1% GDP (annualised) for Q3 2012, which puts the US on a trajectory for 2% growth for 2012. US GDP growth is expected to improve in the face of ever escalating waves of money printing and ignoring the smoke and mirrors games that the White House and Congress keep playing such as the Fiscal Cliff Drama and soon to see Debt Ceiling 'Crisis', the US looks set to add at least 2.5% GDP for 2013 and probably at least 3% for 2014. Which coupled with ZERO interest rates will continue to exert upward pressure on US house prices for at least the next 2 years. U.S. Exponential Inflation Mega-trend GDP Growth of 2.5% 2013 say hello to real inflation of about 3.5% which illustrates why the US and every other nation is emerged in what is an exponential inflation mega-trend which the below graph clearly illustrates that even on the official CPI inflation measure (which tends to under report real inflation), that the US is no different to any other country which contrary to the delusional deflation propaganda is instead immersed in what has always been an exponential inflation mega-trend which vested interests and what can be only termed as deflation fools have been blindly regurgitating the threats ever since the Great Recession of the 2008-2009, which the graph clearly illustrates amounted to nothing more than a mere blip or as I warned at the time as being a mere deflationary ripple on the surface of an ocean of Inflation.
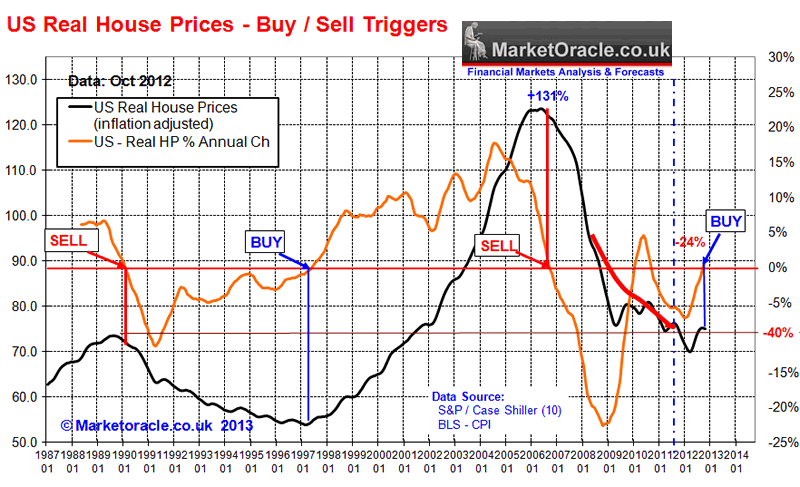
The Inflation Mega-trend Ebook of Jan 2010 (FREE DOWNLOAD), re-iterated that asset prices tend to be LEVERAGED to Inflation, which is precisely the trends that have subsequently transpired from stocks to commodities such as Gold and as I have been flagging during 2012, is expected to transpire for UK and US housing markets so it does not really matter if actual inflation is far higher than official inflation which means it is not necessary to focus on alternative inflation measures if one acknowledges that asset prices tend to be leveraged to official inflation data that go through the stages of being over sold or over bought against inflation due to the impact of investor sentiment. $1 Trillion Coin Ultimate Fiat Currency Illustrates Exponential Inflation Paul Krugman (clueless academic economist) can be seen smugly gloating in the mainstream media as one of his crackpot ideas for the US Treasury to Mint $ 1trillion Dollar Platinum coins with an intrinsic value of about $1,500 (poor Gold bugs, decades of expecting a Gold Standard all the while sneaky platinum bugs had been plotting their own standard), so that the Fed can use them to buy U.S. debt / finance the annual $1 trillion budget deficit and thus end America's exponential debt crisis. So, according to Krugman and most politicians and academic economists is for the US to print money to infinity as a means of conjuring economic growth out of thin air i.e. without having had to earn the money that the US Government will seek to spend. However this does give the general public a window into the game that bankers and politicians are playing and that is one of perpetual money printing the consequences of which is an exponential inflation mega-trend. The madness of the Trillion dollar coin should be obvious to all that if ever the United States did start to mint trillion dollar coins as a means of directly monetizing its debts then it should also replace its stars and stripes with that of Weimar Germany, because no one is going to hold a currency that can be latently so literally printed to infinity within minutes as people can imagine the U.S. Treasury churning out bucket loads of $ 1 trillion dollar coins, then $10 trillion, $100 trillion, $1000 trillion etc... In reality, I doubt that it is actually going to happen, as it is much easier for the people to be confused by the Quantum of Quantitative Easing than see the reality of $1 trillion coins being minted. In terms of US Debt, the Trillion dollar coin is just as ridiculous as the debt ceiling, which means that the debt ceiling will probably eventually be abolished. In terms of PHD Economists - Fiat academia is equally just as worthless to the real world. In terms of hyperinflation - A trillion dollar coin would be a giant leap towards Hyperinflation because once it starts to be minted, it will prove just too tempting to keep minting the coins to pay the bills. In terms of the housing market, know this that whilst governments can easily print currency in all of its forms, however they cannot so easily print houses! The bottom line is that the Trillion dollar coin would be the latest example of fiat currency fraud, for it not to be classed as fraud then the coin would need to weigh about 21,000 tonnes, which is about triple the total amount of platinum ever mined in history! Affordability Illustrates leverage - Falling house prices coupled with static to rising incomes (inflation) illustrates the impact of leverage on the housing market i.e. mortgagees tend to borrow 3.5X earnings, so if earnings have risen by 10% and house prices have fallen by 30%, then that results in an increase of 65% in affordability on where house prices were at the 2006 peak i.e. generally speaking US housing is 65% more affordable against 2006, i.e. a house that cost $200k in terms of borrower affordability at the peak is equivalent to buying a house for $107k today, or near half the peak price. This is reflected in the US affordability index as compiled by NAR that is said to have hit a new all time high of 198.2 New Home Sales Inventory - Hits a 50 year low due to lack of construction during the past 4 years, whilst existing home sale inventories are at a 10 year low as potential sellers are refusing to sell at deep discounts or negative equity. This translates into the US housing market being primed to take off as a consequence of the multiple competing offers lifting sale prices. On the flip side, once a US housing bull market gets going, so will construction of new homes. It is too early in the cycle to say how this will impact house price trends as there are competing consequences i.e. the more construction the greater the confidence to buy / invest / speculate. Demographics - The main demographic mega-trend in the western world if not the whole world is that of an ageing population, what this translates into is an ever decreasing ratio of workers to non workers, for countries such as the UK this crisis is exacerbated by out of control welfare states as a consequence of Labour party creating a pool of vested interest voters who are heavily reliant the welfare state. The key consequence of a falling ratio of workers to non workers is that workers will have less disposable income to feed a housing bull market and thus act as a damper on the housing market. However, the advantage that the US has by virtue of ample land is that it can literally open the flood gates to new arrivals and thus give the economy and the housing market a boost as the number of workers to non workers increases. The key is that the US has an INCREASING population, so all of the commentary that suggests the US is following Japan is NOT going to happen because of this fundamental difference in that Japan's population is declining, with expectations for it to drop by 30% over the next 40 years, whilst US population is expected to increase by more than 30%, so regardless of demographics - that is a lot of demand for new homes to be built! US Housing Market Buy Trigger? The below graph illustrates the state of the US Housing market in terms of its primary long-term driver - inflation, and answers the question posed at the start of this analysis in that has the US housing market triggered a buy signal as defined in June 2008 (US House Prices Forecast 2008-2010) i.e. following the expected real terms downtrend into early 2011.
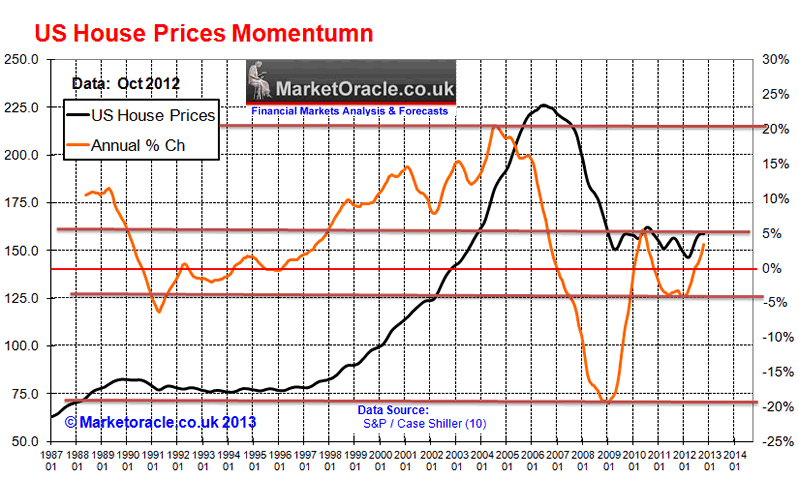
The graph shows that following the expected real terms downtrend forecast into early 2011, continued into the end of 2011 and that subsequently the embryonic bull market of 2012 has triggered a BUY SIGNAL ON the LAST Case Shiller data release (October 2012), that will likely be confirmed on the release of subsequent data over the coming months. U.S. Housing Annual Market Momentum The house price momentum graph shows annual extreme swings of +20% to the Bull market peak and then -20% to the bear market low. This was followed by a corrective swing higher to +5% which then dissipated to -5%, thus unwinding reactions to the preceding 40% swing and sets the scene for a normalisation of momentum for the US housing market over the coming years.
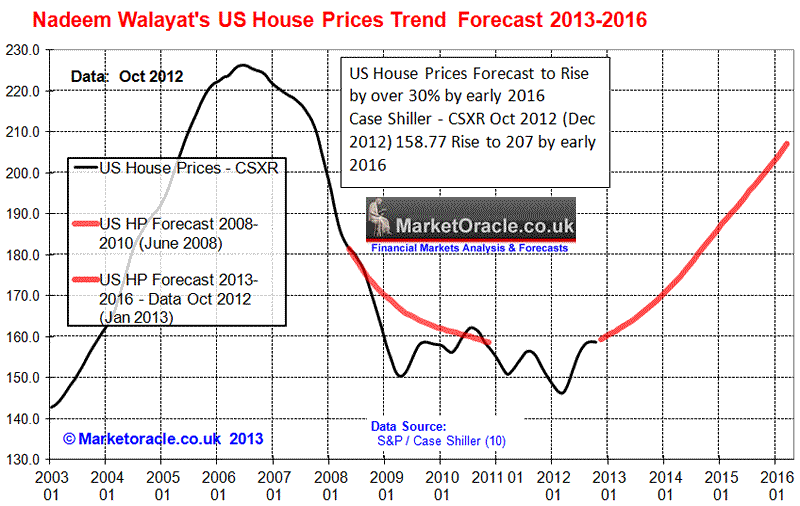
Whilst it is a little too early to determine what the precise momentum will be, however looking back at the preceding bull market suggests that once momentum breaks above 5% per annum, then this is likely to accelerate into a range of between 8% to 12% per annum. Current rising momentum of 3.4% puts the US housing market on achieving such a trajectory during 2013 which implies that US house prices could rise by between 8% to 12% for 2013! US Housing Market Forecast 2013-2016 My analysis has now reached the point where I am confidently able to generate a high probability multi-year trend forecast for US house prices. As mentioned earlier, the fundamentals have already triggered a reliable technical buy trigger, and as illustrated by rising real-terms momentum implies an accelerating trend for the US housing market over the coming years, i.e. as each years % gains prompts higher % gains in the following year as a consequence of ever improving market sentiment that will lead all the way towards the next bubble peak many years from now, but for this analysis I will focus on a trend forecast for over the next 3 years, dating from the last 2 months of of 2012 right through to early 2016 (Case Shiller index) as illustrated by the the below trend graph around which the actual house price index is expected to oscillate.
US House Prices Forecast Conclusion - As your read this, the embryonic nominal bull market of 2012 is morphing into a real terms bull market of 2013, with each subsequent year expected to result in an accelerating multi-year trend that will likely see average prices rise by over 30% by early 2016, which translates into a precise house prices forecast based on the most recent Case-Shiller House Price Index (CSXR) of 158.8 (Oct 2012 - released 26th Dec 2012) targeting a rise to 207 by early 2016 (+30.4%). Implications of an Multi-year Real Terms Housing Bull Market The key implication is that everything that was hated during the housing bust should therefore be loved going forward such as bank stocks! After all, the big banks can never go bust because they will always be bailed out. The central banks of the world have clearly told us what they are going to do and are in fact doing which is to INFLATE all of the debts away for which they do not need gimmicks such as the Trillion Dollar coins to achieve. Therefore House Price Inflation is one of the few avenues open to ORDINARY people to leverage themselves up to the central banks exponential inflation policies and bank stock prices are LEVERAGED to House Prices! i.e. 10% House price increase can in many cases result in a 100% increase in bank stock prices! Inflation WARNING! This is how it is - If I chose not to do nothing i.e. not buy property or dividend paying stocks or other assets leveraged to inflation then I KNOW inflation will wipe out ALL of my wealth and earnings purchasing power - That IS a certainty!, whilst everything else is a probability, risk vs reward, as I continue to attempt to leverage my assets and earnings to inflation, as illustrated by the January 2010 Inflation Mega-trend ebook (FREE DOWNLOAD)
Also subscribe to our new youtube channel for video forecasts and additional educational material. Your analyst loading up on housing market exposure (UK). Source and Comments: http://www.marketoracle.co.uk/Article38458.html Nadeem Walayat Copyright © 2005-2013 Marketoracle.co.uk (Market Oracle Ltd). All rights reserved. Nadeem Walayat has over 25 years experience of trading derivatives, portfolio management and analysing the financial markets, including one of few who both anticipated and Beat the 1987 Crash. Nadeem's forward looking analysis focuses on UK inflation, economy, interest rates and housing market. He is the author of three ebook's - The Inflation Mega-Trend; The Interest Rate Mega-Trend and The Stocks Stealth Bull Market Update 2011 that can be downloaded for Free.
Disclaimer: The above is a matter of opinion provided for general information purposes only and is not intended as investment advice. Information and analysis above are derived from sources and utilising methods believed to be reliable, but we cannot accept responsibility for any trading losses you may incur as a result of this analysis. Individuals should consult with their personal financial advisors before engaging in any trading activities.
You're receiving this Email because you've registered with our website. How to Subscribe Click here to register and get our FREE Newsletter To access the Newsletter archive this link Forward a Message to Someone [FORWARD] To update your preferences [PREFERENCES] How to Unsubscribe - [UNSUBSCRIBE]
The Market Oracle is a FREE Financial Markets Forecasting & Analysis Newsletter and online publication. |
||||||||||||||

 Since which time the bear market in US housing has continued to act as a drag on the US economy, holding it back from recovery, in response to which the US government and central bank have sought to escalate their response in an attempt at engineering an economic bounce so as to induce an sustainable economic recovery of which the
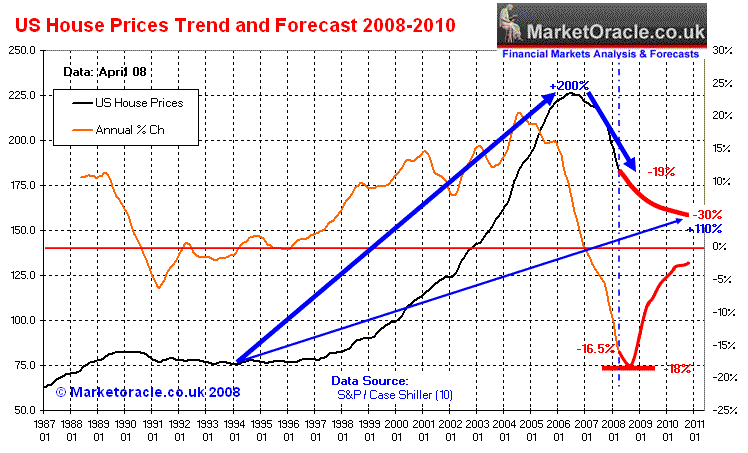

© 2005-2022 http://www.MarketOracle.co.uk - The Market Oracle is a FREE Daily Financial Markets Analysis & Forecasting online publication.