RICS Data Confirms UK Housing Market Heading for 1990's Style Crash
Housing-Market / UK Housing Mar 11, 2008 - 04:44 AM GMTBy: Nadeem_Walayat
 A matter of days after soothing words on the prospects for UK house prices for 2008 were issued by the chief economist of Britain's largest Mortgage Bank (The Halifax), the Royal Institute of
Chartered Surveyors released data today which shows the worst margin between rising and falling house prices since the height of the 1990's property crash.
The RICS data shows that only 4% of surveyors reported a price rise against 57% reporting price falls, thus resulting in a net negative reading of 53%, which seasonally adjusts to a 64% negative reading, the worst since June 1990. Stocks of unsold inventory continue to build up on surveyors books to levels not seen in a decade and up more than 50% over the last 12 months.
Home sellers hoping to escape the property slump via the quick auction route may find the situation there having further deteriorated since the most recent analysis of 2nd December showed a near 1/3rd of properties unable to be sold at that time despite cuts in reserve prices from months earlier.
As this analyst warned in an article barely 3 days ago, the UK housing market is primed for a crash that is scheduled to occur in April 2008 following the changes in capital gains taxes, though this is not the reason for falling house prices but merely a triggering point. Today's RICS data merely illustrates the tail end of the hurricane that is about to hit the UK housing market, which will be far more lasting and damaging than the recent stormy weather that has battered much of Britain's coastline.
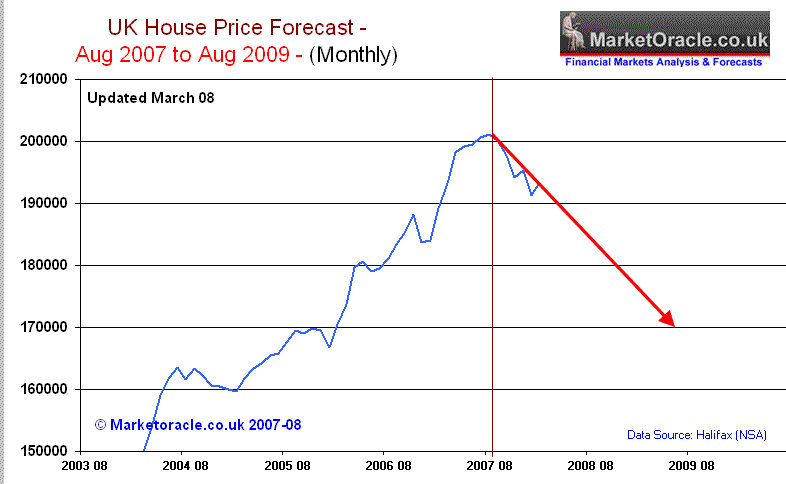
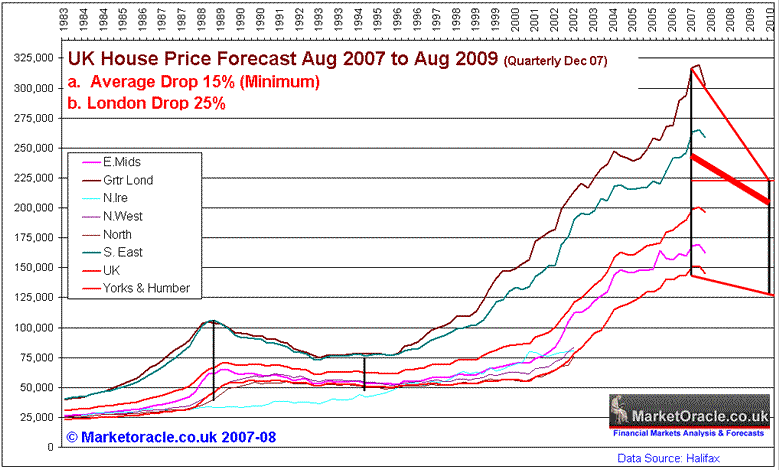
The prospects for the UK housing market is to continue to trend towards at least a 15% fall in average house prices over 2 years from August 2007 to August 2009 (Data:Halifax NSA).


 Even property shows such as the BBC's popular and entertaining 'Homes Under the Hammer' is finding it difficult to present a positive picture on the outcome of auction buyers ability to realise a gain on their speculative refurbished buys. Instead of the slickly dressed walk on estate agents announcing potential profits of several tens of thousands of pounds, as used to be the case, now are being replaced with wide ranging rental value estimations. Defensive smiles from the property speculators cannot hide the fact that yields of under 4.5% are nothing much to smile about given the risks of capital loss, and this taken from programming shot during the second half of 2007. It will therefore be interesting to see what current programming reveals in say 4 to 6 months time.
 The reasons why the UK housing market is heading towards a crash are many, and have been iterated numerous times since May 2007 which can be revisited in the extensive articles archive. Home owners hoping that interest rate cuts will able to halt the decline will find disappointment in that expectation, as sentiment switches from greed to fear. From the prospects of capital gains to the realisation of capital losses as expressed in the loss of equity far beyond that of the £30 or so saved in interest payments per month following each 0.25% base rate rate cut. That is IF the banks in their decimated state are willing or even able to pass on the rate cuts to their increasingly high risk mortgage borrowers. No, not even wishful thinking that the government will step in to save the day will come to pass as we have seen with the Northern Rock debacle. A bank which is driving mortgage interest rates higher so that mortgage borrowers remortgage to another bank and hence Northern Rock moves that step closer to repayment of the £50 billion loaned from the British tax payer.
The UK has already witnessed the once booming flats and commercial property market crash. The plug pulled from under many commercial property funds starting in late last year, as the investment funds ran dry of cash and become forced sellers of properties to meet panic redemption requests from investors in the face of sharp falls in fund unit values. Those that remain in the funds, are now increasingly locked into depreciating assets.
The buying instead of renting dead money mantra never really stood up to proper scrutiny as highlighted back in October 2007, the relative costs between the two are never usually properly evaluated when seen through the rose tinted glasses of perpetual money for nothing capital appreciation during a mania driven market environment.
By Nadeem Walayat
Copyright © 2005-08 Marketoracle.co.uk (Market Oracle Ltd). All rights reserved.
Nadeem Walayat has over 20 years experience of trading, analysing and forecasting the financial markets, including one of few who both anticipated and Beat the 1987 Crash. Nadeem is the Editor of The Market Oracle, a FREE Daily Financial Markets Analysis & Forecasting online publication. We present in-depth analysis from over 120 experienced analysts on a range of views of the probable direction of the financial markets. Thus enabling our readers to arrive at an informed opinion on future market direction. http://www.marketoracle.co.uk
Disclaimer: The above is a matter of opinion provided for general information purposes only and is not intended as investment advice. Information and analysis above are derived from sources and utilising methods believed to be reliable, but we cannot accept responsibility for any trading losses you may incur as a result of this analysis. Individuals should consult with their personal financial advisors before engaging in any trading activities.
Attention Editors and Publishers! - You have permission to republish THIS article if published in its entirety, including attribution to the author and links back to the http://www.marketoracle.co.uk . Please send an email to republish@marketoracle.co.uk, to include a link to the published article.
Nadeem Walayat Archive |
© 2005-2022 http://www.MarketOracle.co.uk - The Market Oracle is a FREE Daily Financial Markets Analysis & Forecasting online publication.


