


A Historical Perspective Of Silver Price Correction
Commodities / Gold and Silver 2013 Apr 12, 2013 - 10:35 AM GMT

 When trying to determine when a market correction may be ending, it only makes sense to look at past corrections to help determine a general guideline. This really does not have to be a complicated process and the results from some quick analysis can be quite helpful.
We believe that Silver is in its fourth intermediate term bull market correction and we would like to see how it measures up to the other three.
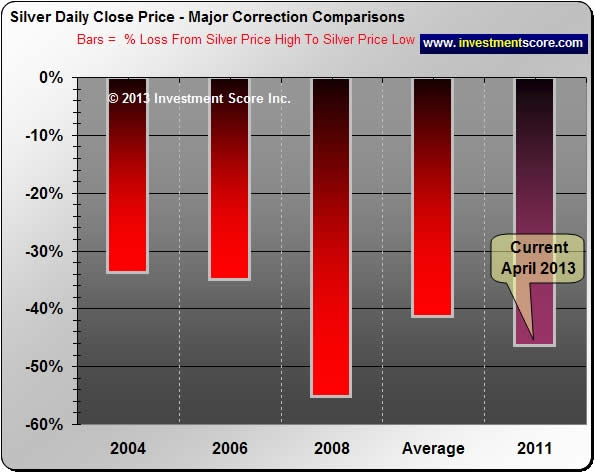
The above chart helps us compare the percentage drop from the top of each correction to their lows. This is remarkably helpful as it gives us a general idea of what may be considered “normal” for a silver bull market pullback.
As we know, in 2008 the extreme circumstances of the Credit Crunch really helped push down all markets. The lack of credit to consumers, investors and institutions caused the volatile silver market to fall an impressive 55% from peak to trough. Amazingly this massive correction did not end this impressive bull market up trend. If a 55% correction is not the “maximum” percentage drop that we should expect from a bull market correction, it should be somewhere close. This 55% Aggressive and 41% Average percentage correction for this bull market is a helpful guideline to compare our current low of 46% to.
But how long do these bull market corrections typically last?
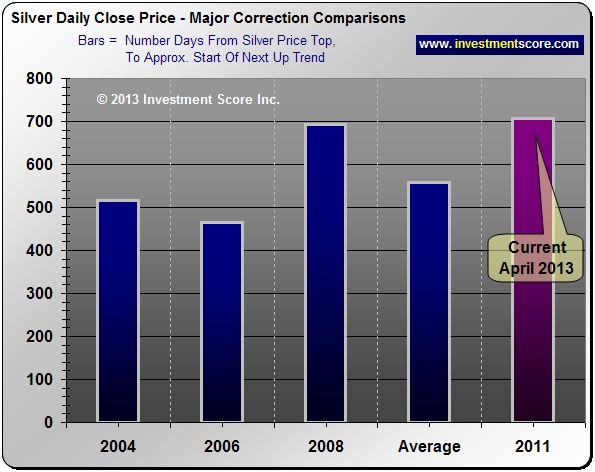
In the above chart we can see how many days the current correction in the price of silver has lasted compared to past intermediate term pullbacks. The point at which a correction ends can be a little subjective as one may be inclined to pick the extreme low of the correction or when a new high is reached etc. For our analysis we picked the best buying opportunity just prior to the following uptrend. We can see above that the current correction is getting a little “long in the tooth” compared to other intermediate term pullbacks in the current bull market.
In terms of depth and duration it appears that the current intermediate term correction is closer to an end than a start. Note that we said “closer” and not “at”. These types of comparisons are only guidelines and assume that the bull market itself is not over. Of course the price of silver can correct further, it can last longer and it may never go back up. However, our proprietary long term charts and other indicators lead us to believe the long term bull market is well in tact and we find these kinds of charts both helpful and bullish.
If you found this editorial interesting you may want to sign up for our free newsletter and learn more about our service at www.investmentscore.com.
By Michael Kilback
Investmentscore.com
Investmentscore.com is the home of the Investment Scoring & Timing Newsletter. Through our custom built, Scoring and Timing Charts , we offer a one of a kind perspective on the markets.
Our newsletter service was founded on revolutionary insight yet simple principles. Our contrarian views help us remain focused on locating undervalued assets based on major macro market moves. Instead of comparing a single market to a continuously moving currency, we directly compare multiple major markets to one another. We expect this direct market to market comparison will help us locate the beginning and end of major bull markets and thereby capitalize on the largest, most profitable trades. We pride ourselves on cutting through the "noise" of popular opinion, media hype, investing myths, standard over used analysis tools and other distractions and try to offer a unique, clear perspective for investing.
Disclaimer: No content provided as part of the Investment Score Inc. information constitutes a recommendation that any particular security, portfolio of securities, transaction or investment strategy is suitable for any specific person. None of the information providers, including the staff of Investment Score Inc. or their affiliates will advise you personally concerning the nature, potential, value or suitability or any particular security, portfolio of securities, transaction, investment strategy or other matter. Investment Score Inc. its officers, directors, employees, affiliates, suppliers, advertisers and agents may or may not own precious metals investments at any given time. To the extent any of the content published as part of the Investment Score Inc. information may be deemed to be investment advice, such information is impersonal and not tailored to the investment needs of any specific person. Investment Score Inc. does not claim any of the information provided is complete, absolute and/or exact. Investment Score Inc. its officers, directors, employees, affiliates, suppliers, advertisers and agents are not qualified investment advisers. It is recommended investors conduct their own due diligence on any investment including seeking professional advice from a certified investment adviser before entering into any transaction. The performance data is supplied by sources believed to be reliable, that the calculations herein are made using such data, and that such calculations are not guaranteed by these sources, the information providers, or any other person or entity, and may not be complete. From time to time, reference may be made in our information materials to prior articles and opinions we have provided. These references may be selective, may reference only a portion of an article or recommendation, and are likely not to be current. As markets change continuously, previously provided information and data may not be current and should not be relied upon.
Investmentscore.com Archive |
© 2005-2022 http://www.MarketOracle.co.uk - The Market Oracle is a FREE Daily Financial Markets Analysis & Forecasting online publication.