U.S. Bond Market Breakdown
Interest-Rates / US Bonds May 07, 2013 - 03:03 PM GMT "Facts are the enemy of truth."- Don Quixote - "Man of La Mancha"
Last week we had the FOMC decision by the US Federal Reserve in which they said that they would continue purchasing US $85 billion a month with basically no end in sight. Aside from that they stated for the first time that they would consider increasing the amount purchased (QE) if the economy were to weaken further. So I don’t have to be able to read the tea leafs to know that puts the Fed squarely on it’s chosen path of monetary stimulus, or QE as it is called, where they go into the bond market and continue to buy debt while holding rates at zero. During the first quarter the Fed purchased 72% of all new debt issued, so you could say it is a market maker. Some might go so far as to say that they are the market.
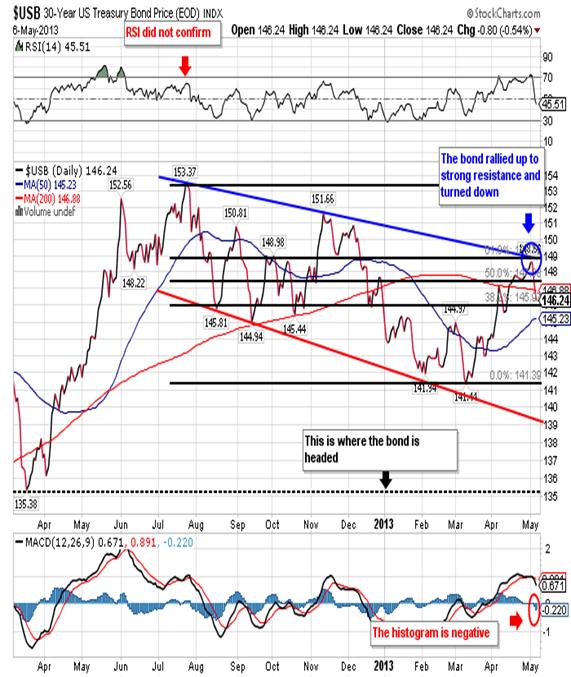
Given what I’ve just said it would be logical to assume that bond prices would at the very least hold steady, and it wouldn’t surprise anyone if they rallied. Rising bond prices would of course translate to lower interest rates and that’s what the Fed wants. I know a lot of my clients follow that logic and continue to buy bonds. Unfortunately, the bond vigilantes take a different view so we end up with something that looks like this:

You can see that bonds topped in July 2012 and then moved methodically lower to the March 2013 low of 141.44. This was followed by a reaction that retraced 61.8% of the decline and stopped just shy of the top band of the downward sloping (blue) trend line. The closing high came on May 1st at 148.60, the day of the FOMC decision! It is worth noting that bonds spent twelve sessions trading at 147.50 or higher and could not move up through the 148.69 resistance from the 61.8 retracement. That in my book is called distribution!
So we had an initial leg down from 153.37 to 141.44 that lasted approximately eight months. This was followed a seven week reaction that retraced 61.8% of the decline and includes a period of distribution. Now that the distribution is over we experienced a sharp decline down to yesterday’s close at 146.24 and the June bond futures contract is down again this morning as investors sold into a rally that occurred last night. Also, I find telling interesting that each and every rally has been sold into for the last twelve sessions.
How is it that the Fed can come out and say that it will maintain its rate of purchases, and could even increase the rate, and yet bond prices take a tumble? Since the bond market is a forward looking instrument, focusing its attention five or six months down the road, you have to wonder what it sees that upsets it so much. My guess is that it sees an end to QE, forced or otherwise, and that would lead to a major sell-off in the bond market. Sooner or later the Fed will succumb to pressure to stop increasing the level of debt. Either we’ll see internal pressure from within the US, or we’ll see foreign holders of US debt dumping bonds.
One needs to understand that there are trillions of dollars worth of debt floating around out there so the current level of QE, US $85 billion a month, is a drop in the bucket. In fact it doesn’t even cover the estimated US $1.2 trillion deficit that’s projected for 2013. Once the Fed announces that they will need to increase QE, and they will have to at some point, it will be obvious to anyone with a brain that QE is a failed policy. I know that most people can’t remember what they had for breakfast yesterday, but it is worth remembering that we’ve already enjoyed QE, QE2 and Operation Twist, and we still can’t make any progress with the economy. We are now coming out of the ether and about to realize that QE3 didn’t work either.
Aside from the fact that the bond pays a negative interest rate in real terms you have to remind yourself that it is a US dollar denominated instrument. Then you have to remember that the dollar has been declining since 2001 so you have a loosing combination. Anyone you purchased bonds in 2001 has lost money in real terms! Now that the dollar appears to have turned down once again, these loses will accelerate putting further pressure on foreign holders of our debt to exit their positions.
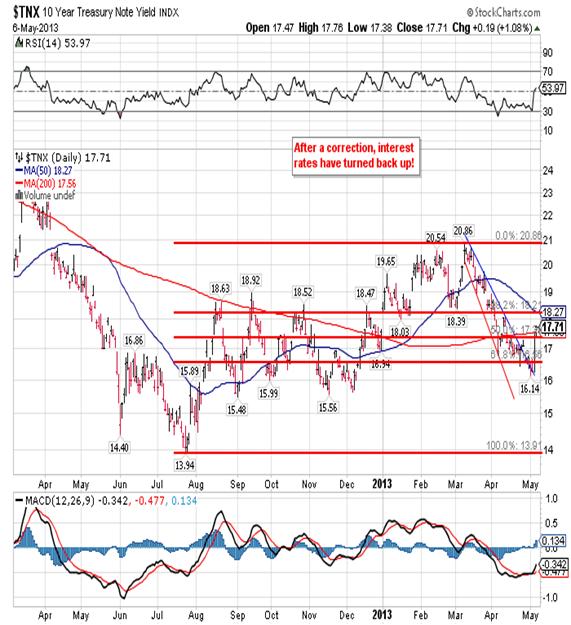
The real clincher comes once the Fed realizes that it can no longer buy debt. Just because the Fed can’t buy debt, it doesn’t mean they’ll stop printing. The Fed will in fact print even more as they shift to what is known as overt monetary stimulus. This is where the Fed simply prints money and gives it to the Department of the Treasury without the previously required emissions of debt. Interest rates have been quietly rising as you can see below:

Once the Fed begins giving money away, the US dollar will plummet and the interest rate will skyrocket. That of course means that bond prices will crash.
In conclusion, this is the direction in which we’re now headed and the only question in my mind is how long it takes us to get there. I believe that bonds are now beginning their second leg down to the 135.00 area of support, and I don’t think it will take more than two months to get there. What kind of a rally we have at that point will depend on how much the economy slows over that period. and whether or not the Fed has increased QE. If they have then we’re that much closing to seeing overt financial stimulus and bonds could move down and through 135.00 without much of a bounce. On the other hand should the Fed cut back on QE bonds would fall to a minimum of 124.00 without much of a reaction. In other words, you’re damned if you do and damned if you don’t.
(Disclosure: I should say that I am short bonds and I manage portfolios for clients that are short bonds, so I have a vested interest in being right)
Robert M. Williams
St. Andrews Investments, LLC
Nevada, USA
Copyright © 2013 Robert M. Williams - All Rights Reserved Disclaimer: The above is a matter of opinion provided for general information purposes only and is not intended as investment advice. Information and analysis above are derived from sources and utilising methods believed to be reliable, but we cannot accept responsibility for any losses you may incur as a result of this analysis. Individuals should consult with their personal financial advisors.
Robert M. Williams Archive |
© 2005-2022 http://www.MarketOracle.co.uk - The Market Oracle is a FREE Daily Financial Markets Analysis & Forecasting online publication.


