U.S. Housing Market Important Data that Financial Media Ignored
Housing-Market / US Housing May 24, 2013 - 08:26 AM GMTBy: J_W_Jones
 Wednesday was a wild trading session where we saw the largest intraday selloff in the S&P 500 E-Mini futures that we have seen in some time. Intraday price action was driven largely by statements made by Chairman Bernanke and the release of the Federal Reserve Meeting Minutes which saw some monster intraday moves and a large spike in the Volatility Index (VIX).
While the world is focused on when the Federal Reserve is going to taper their Quantitative Easing program and the impact those actions will have on financial markets, I wanted to look at another divergence in the economic data which is supported by market action.
Instead of trying to determine how or when the Federal Reserve will taper or end their monetary experiment, I wanted to juxtapose statements that were made today with the actual facts. Readers can draw their own conclusions.
Recently, we have been told that the housing market is in the early stages of recovery. Unfortunately due to low interest rates housing has turned back into a speculative market. Consequently, a lot of so-called fast money is flowing into housing which in many cases is either being purchased for rentals or by foreign investors as a speculative investment.
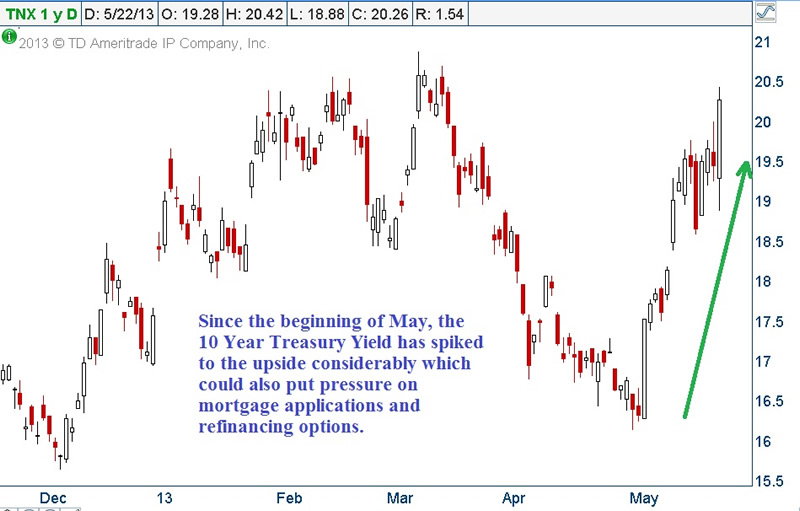
At present the housing market is not being driven by capital formation at the household level and data indicates that construction jobs are under pressure and affordability is reversing. The chart below illustrates what has recently transpired in the 10 Year Treasury Yield:

As can be seen above, the 10 Year Treasury yield has risen considerably since the beginning of the month of May. Normally when interest rates are rising and Federal Reserve policy is indicating that a form of tightening seems likely we typically see a rush of mortgage applications and home starts as borrowers try to lock in lower interest rates. Furthermore, the spring and early summer months are generally considered a very favorable time to sell existing homes in the United States.
In light of all of the above mentioned facts paired with our Federal Reserve Chairman stating that housing is starting to recover, readers would expect that housing starts and mortgage applications would be jumping higher.
Unfortunately the mortgage application data came out on a day when the Federal Reserve was controlling the headlines. The mortgage application data indicated the largest 2-week rate of decline in mortgage applications since the housing bubble popped.
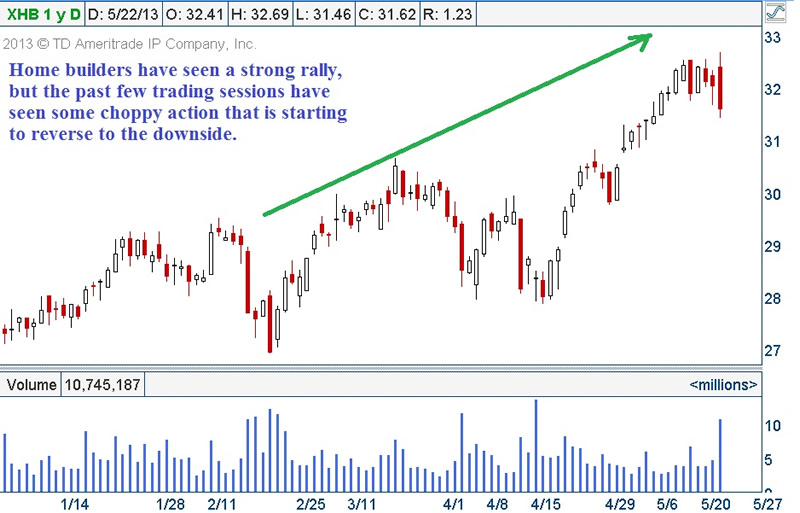
Furthermore, this is supposed to be a strong seasonal time for real estate and interest rates are rising as shown above. If readers look at recent price action in the Spiders Homebuilders ETF (XHB) or Home Depot (HD) it would appear that all is well in the land of housing and Chairman Bernanke and the Federal Reserve are spot on with their bullish analysis.

Until the past few trading sessions, the homebuilders have been in an obvious bullish run to the upside. The rally that transpired since the late February 2013 lows tacked on close to 20% gains in XHB. However, as noted above, the past few trading sessions’ price action appears to have stagnated and we saw new recent lows on Wednesday.
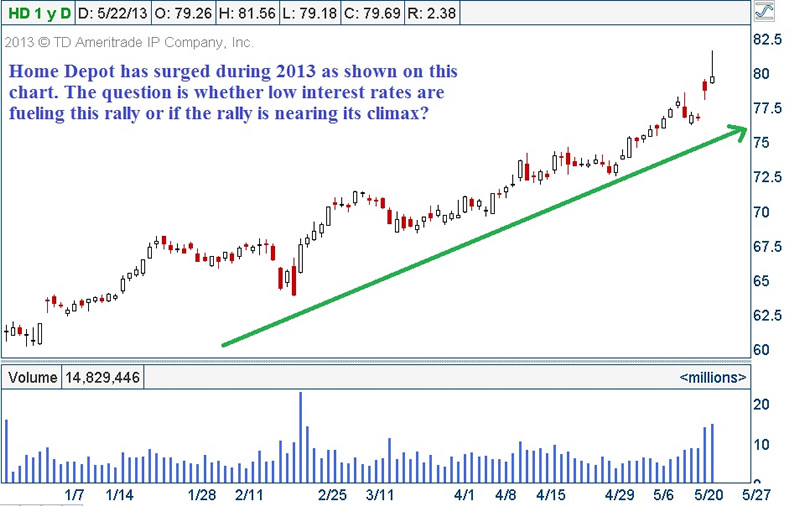
Home Depot (HD) is another stock that relies heavily on home construction and improvement and would likely benefit from both new home building and existing home purchases which typically require immediate customization or improvements. The recent price action in Home Depot is shown below.

Home Depot has had an impressive rally since the beginning of 2013. HD has tacked on over 20 points on its share price representing a near 30% move higher year to date. However, exuberance on Tuesday after earnings were released saw a spike Wednesday morning which was promptly reversed intraday.
Based on the recent price action in both the homebuilders ETF (XHB) and Home Depot (HD) readers would tend to agree with Chairman Bernanke that housing was recovering and that the recent mortgage application decline was merely “transitory.”
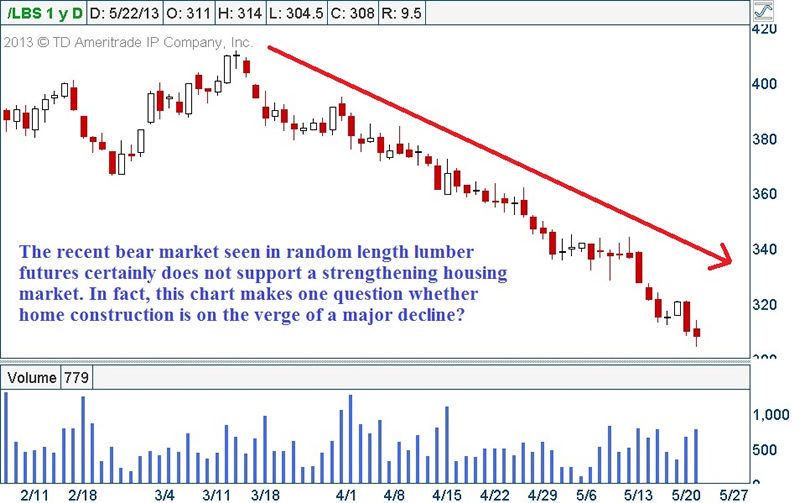
However, there is one eye-opening concern that does not support Chairman Bernanke’s position about a housing recovery and unfortunately points to less demand in the immediate future. While many investors do not track lumber prices, the chart below demonstrates the sheer bear market that has befallen lumber futures prices.

As can be seen above, random length lumber futures have gotten crushed to the downside over the past two months. In early March, lumber futures were trading up around the 410 price point. At the close on Wednesday, random length lumber futures closed at 305.20, a more than 25% drop in price in roughly 2 months.
How is housing rebounding with lumber prices falling? While Home Depot sells many products, most major remodeling projects and even smaller upgrades require the purchase of lumber. Have logging companies discovered an untapped lumber resource?
I will let readers decide whether to believe the price of lumber and mortgage application data or a Federal Reserve Chairman that declared on January 10, 2008 that “The Federal Reserve is not currently forecasting a recession.”
For those paying attention, the macroeconomic data is crumbling in the United States and Europe. The printing press and monstrous liquidity can only fuel markets for so long. Can Chairman Bernanke and the Federal Reserve print Cap-EX spending increases and rising profitability? I think we all know the answer. In the end, when the Federal Reserve is printing $85 billion dollars per month to buy U.S. government debt perhaps fundamentals are largely irrelevant.
Need 2-3 Trades Per Week Trading Strategy?
Need a Steady Profit Earning Trading Strategy?
SAVE 50% Now – Enter Coupon “MDAY50”
Join www.OptionsTradingSignals.com today
JW Jones
J.W. Jones is an independent options trader using multiple forms of analysis to guide his option trading strategies. Jones has an extensive background in portfolio analysis and analytics as well as risk analysis. J.W. strives to reach traders that are missing opportunities trading options and commits to writing content which is not only educational, but entertaining as well. Regular readers will develop the knowledge and skills to trade options competently over time. Jones focuses on writing spreads in situations where risk is clearly defined and high potential returns can be realized.
This article is intended solely for information purposes. The opinions are those of the author only. Please conduct further research and consult your financial advisor before making any investment/trading decision. No responsibility can be accepted for losses that may result as a consequence of trading on the basis of this analysis.
J.W. Jones Archive |
© 2005-2022 http://www.MarketOracle.co.uk - The Market Oracle is a FREE Daily Financial Markets Analysis & Forecasting online publication.


