Investors Beware: Underlying Weakness in Stock Market
Stock-Markets / Stock Markets 2013 Jun 06, 2013 - 10:11 AM GMT George Leong writes: The Dow Jones Industrial Average (DJIA) is down 2.3% from its record-high on May 28, but just like the S&P 500, the DJIA appears to be flashing some fatigue on the charts, suggesting some stock market risk and possible market correction.
Now, this may only be a temporary pause, or it could be foreshadowing some upcoming selling, stock market risk, or a potential buying opportunity.
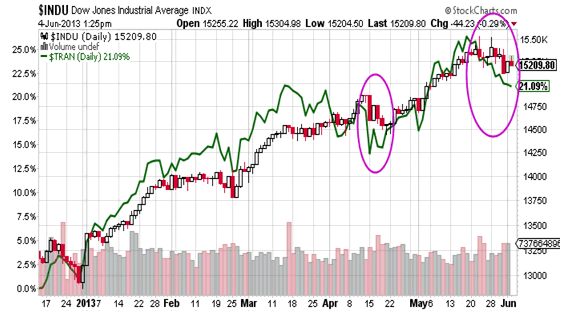
The chart featured below of the DJIA (shown in the red candlesticks) and the Dow Jones Transportation Index (in green) shows a decline in both (marked by the larger purple oval). This may indicate that something bigger is coming, or, as the case was in mid-April (as indicated by the smaller purple oval), we may just be seeing a market adjustment prior to another rally.

Chart courtesy of www.StockCharts.com
What will be interesting to monitor is if the transports follow the industrials higher on the chart. If so, it would help to confirm the move in the industrials.
If the transports fail to follow the industrials higher, however, it could suggest a bearish divergence and stock market risk, pointing to some upcoming selling.
The reasoning of Dow theory makes sense: if the country is producing and selling more goods, then we can expect the shipping business to also rise, including rail, truck, and ship, which is something the transports will indicate.
At this point, the industrials and transports are confirming each other. On the industrials, watch the 14,500 to 14,750 area on the above chart. Failure to hold here could drive stock market risk and cause the industrials to retrench to their previous sideways channel below 15,000.
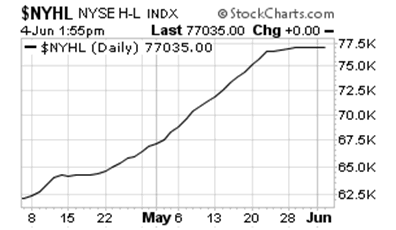
Also on a technical note, the new highs and lows on the New York Stock Exchange (NYSE) High-Low Index are also showing some wear and tear from over the past seven days. The chart featured below shows the recent flattening after the run-up and possible stock market risk.

Chart courtesy of www.StockCharts.com
For instance, in the period from May 23 to June 3, there was a daily average of 85 new highs and 14 new lows. In comparison, from the start of the year to May 22, the daily averages delivered 217 new highs and 13 new lows—more indicative of market strength.
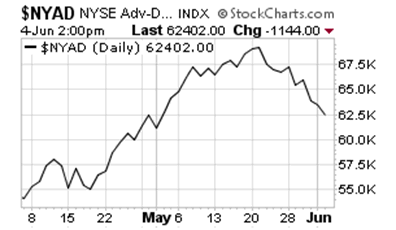
The underlying market breadth on the NYSE, as reflected by the advance decline line, also shows some weakness, as indicated by the reversal in the chart below, and added stock market risk.
Featured below is the NYSE Advance Decline Line chart, from April 8 to early June:

Chart courtesy of www.StockCharts.com
The reality is that the stock market is showing some fragility, so there could be some stalling or market adjustments surfacing in the coming weeks if the stock market risk rises.
Just be ready for a possible buying opportunity on any sustained period of selling.
Source:http://www.investmentcontrarians.com/stock-market/investors-bewa..
By George Leong, BA, B. Comm.
www.investmentcontrarians.com
Investment Contrarians is our daily financial e-letter dedicated to helping investors make money by going against the “herd mentality.”
George Leong, B. Comm. is a Senior Editor at Lombardi Financial, and has been involved in analyzing the stock markets for two decades where he employs both fundamental and technical analysis. His overall market timing and trading knowledge is extensive in the areas of small-cap research and option trading. George is the editor of several of Lombardi’s popular financial newsletters, including The China Letter, Special Situations, and Obscene Profits, among others. He has written technical and fundamental columns for numerous stock market news web sites, and he is the author of Quick Wealth Options Strategy and Mastering 7 Proven Options Strategies. Prior to starting with Lombardi Financial, George was employed as a financial analyst with Globe Information Services. See George Leong Article Archives
Copyright © 2013 Investment Contrarians- All Rights Reserved Disclaimer: The above is a matter of opinion provided for general information purposes only and is not intended as investment advice. Information and analysis above are derived from sources and utilising methods believed to be reliable, but we cannot accept responsibility for any losses you may incur as a result of this analysis. Individuals should consult with their personal financial advisors.
Investment Contrarians Archive |
© 2005-2022 http://www.MarketOracle.co.uk - The Market Oracle is a FREE Daily Financial Markets Analysis & Forecasting online publication.


