Beat the Credit Crisis Road Map to Profits
Commodities / Resources Investing Mar 21, 2008 - 06:07 AM GMT Larry Edelson writes: Is it wild and wooly out there or what? The onslaught of nightmarish news about the U.S. economy has hit financial markets around the world like a Category 5 hurricane.
Wild, short-term swings in the markets can often be confusing. But through it all, the major trends remain firmly intact:
![]() The Federal Reserve will continue to do everything in its power to prevent a financial meltdown, pumping in fiat money like there's no tomorrow. Accepting more and more forms of weak collateral to lend even more money to the system. Slashing interest rates. And more.
The Federal Reserve will continue to do everything in its power to prevent a financial meltdown, pumping in fiat money like there's no tomorrow. Accepting more and more forms of weak collateral to lend even more money to the system. Slashing interest rates. And more.
This is inflationary. Period.
![]() The dollar, save a bounce here and there, will continue to decline in value against every major, and almost every minor currency on the planet.
The dollar, save a bounce here and there, will continue to decline in value against every major, and almost every minor currency on the planet.
This is inflationary. Period.
![]() China and India's economic growth — despite what you hear and read to the contrary — continues to barrel ahead.
China and India's economic growth — despite what you hear and read to the contrary — continues to barrel ahead.
This is inflationary. Period.
![]() Global demand for natural resources remains at record highs in virtually every commodity.
Global demand for natural resources remains at record highs in virtually every commodity.
This is inflationary. Period.
![]() Meanwhile, supplies of most major natural resources remain tight as a drum. In oil, in gold, in wheat, in platinum, and more.
Meanwhile, supplies of most major natural resources remain tight as a drum. In oil, in gold, in wheat, in platinum, and more.
This is inflationary. Period!
All told, I count EIGHT inflation forces striking the U.S. — all at the same time. That's despite the fact that real estate remains in a bear market and the country is already deep in a recession.
I explain all the details of the eight inflationary forces in the March issue of my Real Wealth Report , which goes to press on Friday. Don't miss it.
As for today, I think this is a good time to take a step back ... and give you another look at the charts and my signals, or what I like to call ...
My Roadmap to Profits ...
By periodically looking at the charts, you get to see how the short-term price action fits in with the longer-term view or big picture.
Let's start by going back a few months, to my last roadmap update on January 17 in Money and Markets . In that issue, I said ...
"... 2008 is going to be a doozy. We're going to see wild swings in virtually all markets ... lots of fake out moves ... new trends emerge ... and old trends become reinvigorated.
— The sinking dollar, which has much more to fall ...
— The crumbling empire of debt in the U.S. of which the subprime crisis is just the opening act ...
— The surprising inflation that is going to soon shock almost everyone ...
— And soaring prices for natural resources, which are now entering their next phase, an accelerated up-move that will take most investors by surprise, but be the most profitable phase yet."
Now, let's see how each market roadmap has held up ...
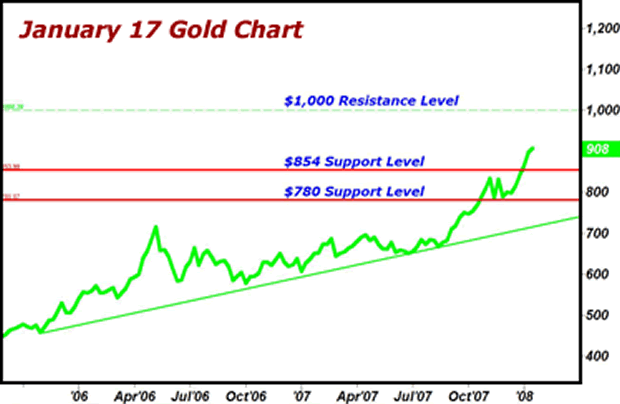
Gold: Here's what the chart looked like back in January.
And here's what I said back then:
"Major support is way down at the $854 level.
On the upside, gold is in uncharted territory, record highs. The key points to watch are the $1,000 level, which should pose some psychological resistance, followed by $1,250."
"Your general strategy toward gold should be: Buy weakness, buy dips that hold the $854 level. And hold with the objective of seeing gold
trade well over $1,250 later this year."
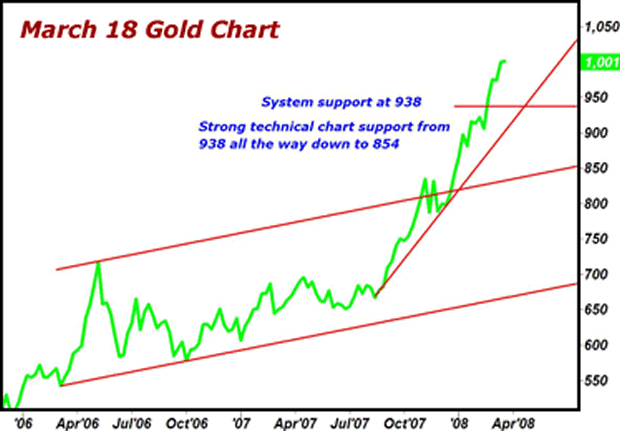
Now, here's my update on gold: Gold has traded as high as $1,034, decisively breaking through the $1,000 level. Next target: $1,250
Don't be surprised if gold retreats before heading higher. If so, it would be a normal, healthy pullback. Gold would likely find support at one of the two levels shown on my updated chart.
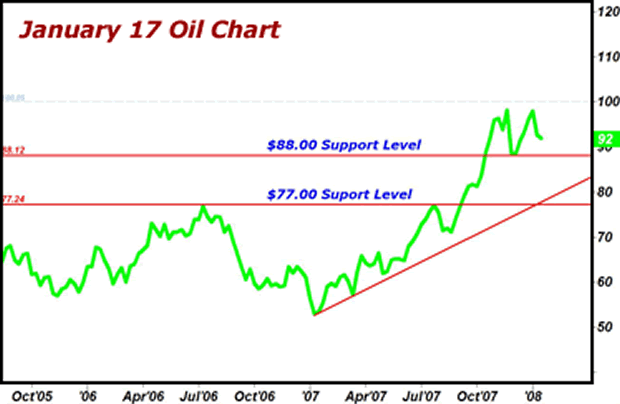
Oil: Here's what the chart looked like back in January.
And here's what I said back then:
"Oil is still very much in a very strong long-term uptrend, with higher prices yet to come."
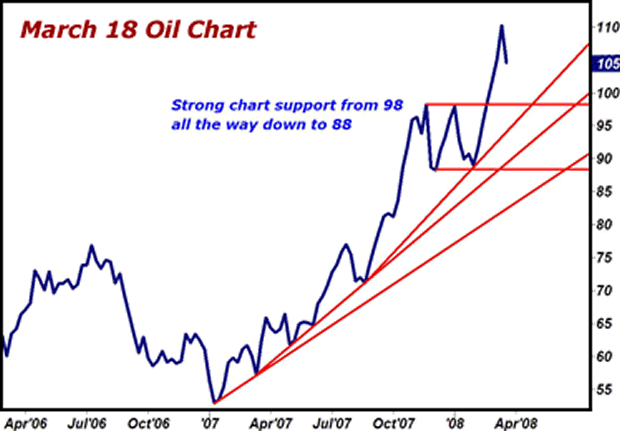
Now, here's my update on oil: Oil hit $100 on Feb 26, and reached as high as $111.80 earlier this week. That's up 21.5% in just two months!
We'll probably see some consolidation, possibly a decline back to the $98 level, which as you can see on the updated chart, should provide strong support.
If oil breaks the $98 level on any decline, look for it to find solid support at the $88 level.
Either way, oil is clearly in a long-term uptrend. Again, it may go through some consolidation, but I expect to see black gold hit $125 as its next main target. From there, it will go even higher!
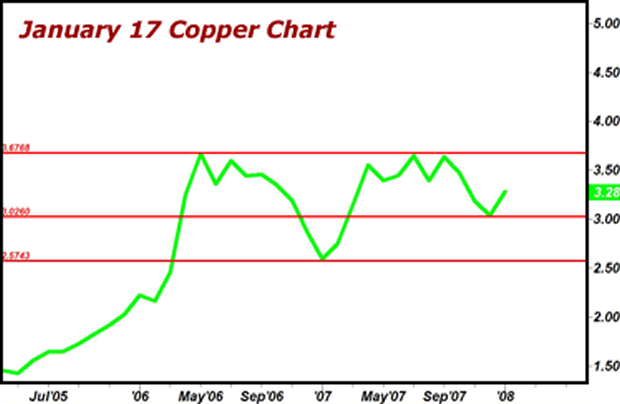
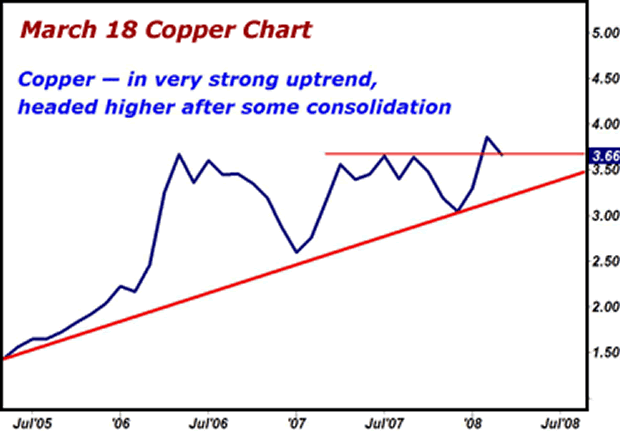
Copper: Here's the chart I showed you back in January, and here's what I said about it ...
"If (copper) closes above $3.67, the metal is off to the races ... to new record highs."
Copper closed above $3.67 on Feb. 20, and then it zoomed to a new record high at $4.02 a pound on March 6, before retreating a tad.
This is amazing, especially considering the real estate disaster in the U.S. and the supposed slowdown in Asia!
The U.S. economic problems are hurting copper demand. But it's more than offset by soaring demand coming from China, India and other emerging economies.
In fact, right now there are only three days of global copper supplies on the shelves!
Now, here's my update on copper: Is copper heading higher? You bet it is! After some consolidation, like we've seen with other metals. Take a look at my updated copper chart — there's solid support at the $3.66 level, followed by $3.45 — $3.50. As long as those support levels hold, which I expect they will, then new record highs remain ahead for copper.
Agricultural Commodities: Back in January, I told you, "Foods are now in a major bull market ... Corn, wheat, soybeans, sugar, and coffee — are all taking off to the upside. This sector will be one of the stars in 2008, with much higher prices to come."
What's happened since the first of the year? Wheat is up 26%. Corn is up 17%. Soybean prices have risen 6%.
I've run out of room for the charts here, but suffice it to say that I expect additional gains (and profits) in food prices going forward.
Now, let's get to one market that's in the forefront of every investor's mind ...
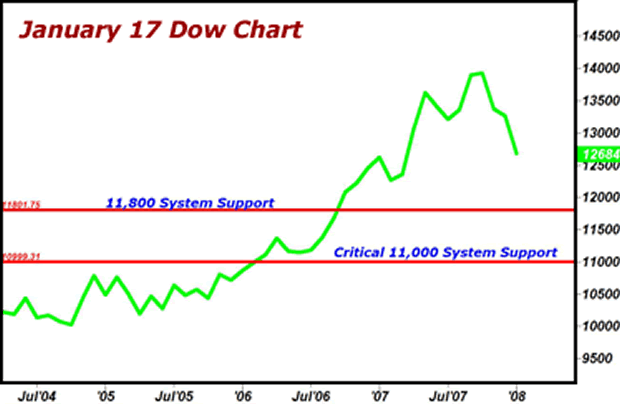
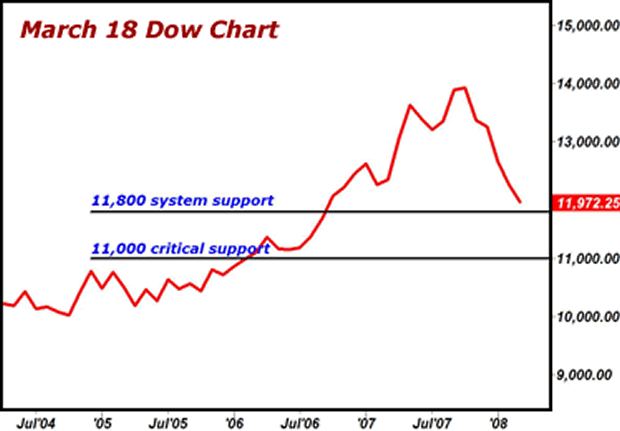
The Dow Jones Industrials: My models continue to point to 11,000 on the Dow, possibly much lower.
Here's the chart from January 17, followed by an updated chart as of March 18.
As you can see, the Dow is following the pattern I laid out for you to a tee. It's bounced off the 11,800 level three times. The next time it tests that area, it should pierce it and swoon to 11,000.
11,000 is a critical level of support on the Dow. If it gives way, look out below.
The most important message from these charts: The major trends — rising commodity prices and rising inflation — are not only very much intact, they're accelerating to the upside.
After some more wild gyrations and pullbacks, I expect new highs in all of the above, except for the Dow!
So stay tuned and watch these signals closely.
Best wishes,
Larry
P.S. Be sure and join me for that in-depth look at the Eight Forces of Inflation — and how to profit from them — in the March issue of my Real Wealth Report , which will be published on Friday.
This investment news is brought to you by Money and Markets . Money and Markets is a free daily investment newsletter from Martin D. Weiss and Weiss Research analysts offering the latest investing news and financial insights for the stock market, including tips and advice on investing in gold, energy and oil. Dr. Weiss is a leader in the fields of investing, interest rates, financial safety and economic forecasting. To view archives or subscribe, visit http://www.moneyandmarkets.com .
Money and Markets Archive |
© 2005-2022 http://www.MarketOracle.co.uk - The Market Oracle is a FREE Daily Financial Markets Analysis & Forecasting online publication.


