


Anatomy of a Stock Market Top
Stock-Markets / Stock Markets 2013 Jun 11, 2013 - 07:29 AM GMTBy: Donald_W_Dony

 There has been much speculation from the media and market pundits regarding the end of the bull market. Whenever there is a day or two of weakness on the S&P 500, predictions of the bull's demise multiples. Yet market tops typically have a distinct pattern that is recognizable and often lasts for months.
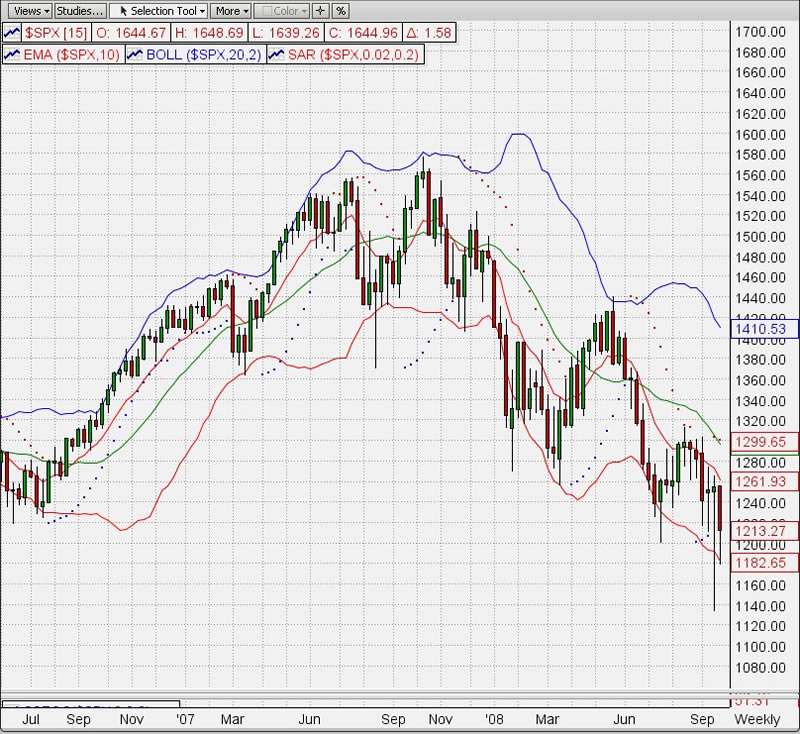
Market peaks normally develop over a period of four to eight months. A price ceiling occurs that investors and traders can not push through. This level is usually tested several times over the course of months.
In Chart 1 of the 2007 crest, the S&P 500 tested 1560 in July and again in October 2007. Both times they were met with solid selling pressure and pushed lower. This was the first time in the 2003-2007 bull market that the U.S. index could not go to new highs.
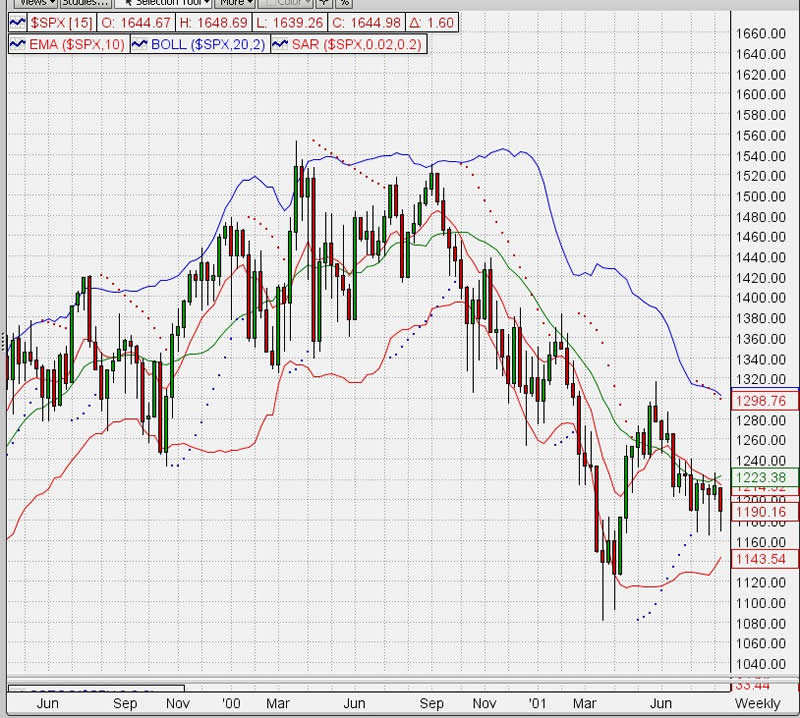
The crest in the previous bull market also had a similar pattern. After advancing from the low in September 1998, the S&P 500 moved steadily higher until mid-2000. There the S&P 500 found solid resistance at 1520. Several times over a seven month period, traders tried to move the index over this level but failed (Chart 2). Only in November 2000, did the U.S. index finally loss momentum and start to roll over.
Bottom line: The trading pattern between an ongoing bull market and an index that has reached a top are completely different. Bull markets are a series of higher highs and low whereas market tops reach a price level that, over many months, can not be broached.
The current trading pattern of the S&P 500 is one of higher highs.
By Donald W. Dony, FCSI, MFTA
www.technicalspeculator.com
COPYRIGHT © 2013 Donald W. Dony
Donald W. Dony, FCSI, MFTA has been in the investment profession for over 20 years, first as a stock broker in the mid 1980's and then as the principal of D. W. Dony and Associates Inc., a financial consulting firm to present. He is the editor and publisher of the Technical Speculator, a monthly international investment newsletter, which specializes in major world equity markets, currencies, bonds and interest rates as well as the precious metals markets.
Donald is also an instructor for the Canadian Securities Institute (CSI). He is often called upon to design technical analysis training programs and to provide teaching to industry professionals on technical analysis at many of Canada's leading brokerage firms. He is a respected specialist in the area of intermarket and cycle analysis and a frequent speaker at investment conferences.
Mr. Dony is a member of the Canadian Society of Technical Analysts (CSTA) and the International Federation of Technical Analysts (IFTA).
Donald W. Dony Archive |
© 2005-2022 http://www.MarketOracle.co.uk - The Market Oracle is a FREE Daily Financial Markets Analysis & Forecasting online publication.