


High and Low Quality Stocks Beat the S&P 500 Index
Companies / Investing 2013 Jun 12, 2013 - 09:24 PM GMTBy: Richard_Shaw

 High quality and low quality stock performance rotate in the short-term, and they both beat the S&P 500.
High quality stocks generally do better in down markets or periods of uncertainty or pessimism. Low quality stocks generally do better in up markets or periods of greater clarity or optimism.
Higher quality stocks have better risk adjusted returns, higher yields and better dividend growth.
Standard & Poor’s said this in their July 2010 report, “Is High Quality Always Better?”, which studied the high and low quality sub-indexes of the S&P 500 index:
“The quality premium, or difference in return of high quality versus low quality, is positive in down markets. Conversely, in up markets the quality premium turns negative.
The quality premium is a function of risk aversion, credit spread, and changes in the slope of the yield curve. During periods of high volatility, widening credit spread, and steepening yield curve, the quality premium tends to be positive.
Conversely, in periods of declining risk, narrowing credit spreads, and flattening yield curves, the quality premium tends to be negative.
… we suggest viewing quality in the same light as style, size, and sector exposures or, in other words, as subject to rotations in various market environments.”
The high quality sub-index includes those stocks ranked A+, A and A-. The low quality sub-index included those stocks ranked B, B-, C. Stocks ranked average at B+ and those ranked D or in liquidation are in neither sub-index. The sub-indexes are quality ranked — the higher quality stocks are more heavily weighted in the high quality sub-index, and the lower quality stocks are more heavily weighted in the low quality sub-index.
Down and Up Stock Market: In their study of the relative performance of high and low quality from May 31, 1997 through May 31. 2010, they found that in down quarters, the total return of the high quality sub-index exceeded that of the low quality sub-index by 1.22%, but in up market quarters the higher quality sub-index underperformed by 0.75%.
Widening and Narrowing Credit Spread: During that period, they found that in quarters where the rate spread between the US aggregate corporate investment grade index and the US 10-year Treasuries is widening, high quality outperformed by 1.59%, and when the spread was narrowing, high quality underperformed by 0.42%.
Rising and Declining Volatility: They found that in quarter with rising volatility as measured by the CBOE VIX, high quality outperformed by 2.23%, and when the VIX declined, high quality underperformed by 0.86%.
Steepening and Flattening Yield Curve: They defined the yield curve in terms of the rate spread between the 2-year and 20-year US Treasury rate; and defined steepening as an increase of 50 basis points or more, and flattening as a decrease of 50 basis points or more. They found that in steepening quarters high yield outperformed by 1.62%, and in flattening it underperformed by 0.15%
Cumulative Total Return Differences: The surprising data about the quality indexes, is that both the high quality and low quality sub-indexes outperformed the complete S&P 500 index. This chart and table from the Fact Sheet on their website for the high quality sub-index shows that.
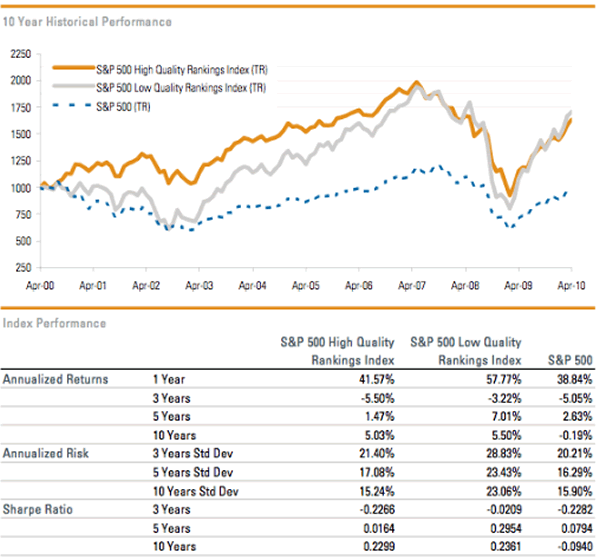
Over the 10 years from 2000 to 2010, the low quality sub-index just barely squeaked out a win over high quality, but low quality was behind more than 1/2 the time. Low quality had a higher volatility, but a somewhat better risk/reward as measured by the Sharpe Ratio.
Price Return Differences Since 2010:
We did our own measure of the price return difference since 04/19/2010 (first data where all data available to us) through 06/11/2013.
Again both high and low quality outperformed the total S&P 500 index, but in this period high quality slightly outperformed low quality.
Specifically, the ending prices were higher than the beginning prices as follows:
- High quality (.SPXQRUP) +45.08%
- Low quality (.SPXQRLUP) + 42.12%
- Total S&P 500 (.SPX) +35.91%
The symbols shown are the Reuters symbols for the indexes.
Recent Relative Performance:
This chart using the Reuters symbols shows the relative performance of the prices of the high and low quality indexes since early 2010. The data is normalized to the beginning set at zero.
The chart shows the ratio of the high quality price divided by the low quality price on a day-by-day basis from 04/19/2010 to 06/11/2013.
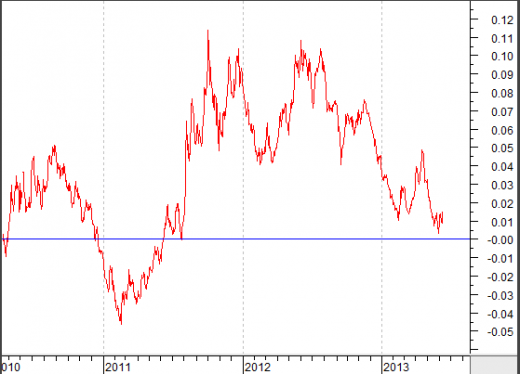
You can see the rapid improvement in high quality in the second half of 2011 when there was lots of panic over Europe; and you can see the decline in high quality relative performance in the second half of 2012 into 2013 as the overall stock market has been rising.
This chart for the same time period, shows the price of the high quality index divided by the price of the full S&P 500 index.
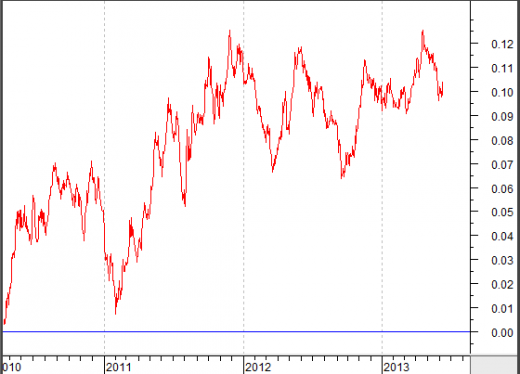
Consistent with data from Standard and Poor’s for the 2000 to 2010 period, high quality outperformed the full S&P 500 index.
Not shown, but clear from the tabular and chart data above, low quality also outperformed the full S&P 500 index.
A Granular View By Quality Rank:
We examined the price performance, standard deviation, Beta, yield and dividend growth rate for 3,116 stocks rated for quality by Standard and Poor’s, that also had at least 3 years of data available. Let’s look at that data which goes well beyond the S&P 500 universe.
The S&P indexes are weighted according to quality. Our study below treats each stock equally.
Number of Stocks By Quality Rank:
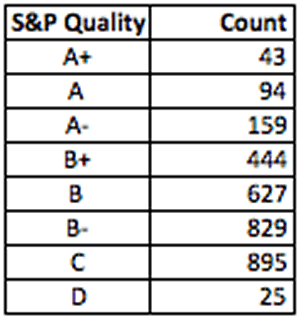
There are a lot more low quality than high quality stocks. Less than 10% are high quality. Standard and Poor’s ranks more stocks than that, but not all had sufficient data in our source to be included here.
Short-Term Price Return By Quality Rank:
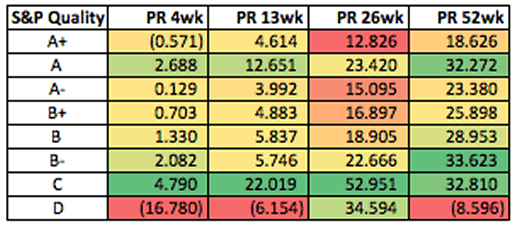
Consistent with the 3-year relative performance chart above, the lower quality stocks have been outperforming over 1 year and 6 months generally, but the mid-high quality “A” rated stocks have been relatively strong on a spotty basis.
3-Year Volatility and Risk Reward:
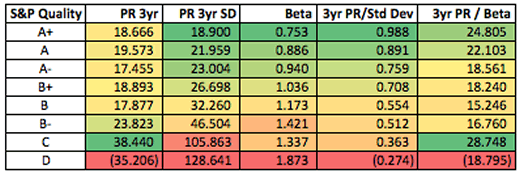
The lower, low quality stocks have outperformed on a price basis over 3 years, however the higher the quality the lower the volatility as measured by both standard deviation and Beta.
The risk adjusted price return, as measured by 3-year annualized price rate of change divided by 3-year annualized standard deviation, is uniformly better the higher the quality. The same is true when price return is adjusted by the Beta with the exception of the “C” rated stocks — but you have to be a big speculator to go to “C” rated stocks to seek opportunity, and can expect a very exciting volatility ride.
Yield and Dividend Growth:
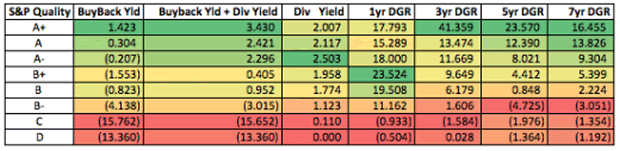
The 1-year buyback yield (based on change in shares outstanding) is definitively higher for high quality stocks, and definitively negative for low quality stocks. The dividend yield is higher among the high quality stocks than the low quality stocks; and the sum of the dividend yield and buyback yield of the high quality stocks is better than the low quality stocks.
The average and upper-end low quality stocks had the highest 1-year dividend growth rate — probably a sign of an improving economy and increase management optimism allowing stocks with below average yields to play some catch-up. Otherwise the higher the quality the higher the 3-year, 5-year and 7-year dividend growth rate.
The 43 Stocks In The A+ Category In Our Study:
| (AAN) | Aaron’s Inc. Com |
| (BAX) | Baxter Internatio |
| (CASY) | Caseys General St |
| (CAT) | Caterpillar Inc. |
| (CHD) | Church & Dwight C |
| (CHRW) | C.H. Robinson Wor |
| (CL) | Colgate-Palmolive |
| (CVS) | CVS Caremark Corp |
| (CVX) | Chevron Corporati |
| (DCI) | Donaldson Company |
| (DHR) | Danaher Corporati |
| (DIS) | Walt Disney Compa |
| (ECL) | Ecolab Inc. Commo |
| (EMR) | Emerson Electric |
| (FDO) | Family Dollar Sto |
| (GWW) | W.W. Grainger In |
| (HRL) | Hormel Foods Corp |
| (IBM) | International Bus |
| (IMO) | Imperial Oil Limi |
| (INT) | World Fuel Servic |
| (JKHY) | Jack Henry & Asso |
| (JNJ) | Johnson & Johnson |
| (K) | Kellogg Company C |
| (KO) | Coca-Cola Company |
| (LLL) | L-3 Communication |
| (LO) | Lorillard Inc Co |
| (MKC) | McCormick & Compa |
| (MMM) | 3M Company Common |
| (NKE) | Nike Inc. Common |
| (NKSH) | National Bankshar |
| (OMC) | Omnicom Group Inc |
| (PG) | Procter & Gamble |
| (PX) | Praxair Inc. Com |
| (ROST) | Ross Stores Inc. |
| (SIAL) | Sigma-Aldrich Cor |
| (SYK) | Stryker Corporati |
| (SYY) | Sysco Corporation |
| (TGT) | Target Corporatio |
| (TJX) | TJX Companies In |
| (UNH) | UnitedHealth Grou |
| (UTX) | United Technologi |
| (WMT) | Wal-Mart Stores |
| (XOM) | Exxon Mobil Corpo |
| (YUM) | Yum! Brands Inc. |
The 94 Stocks In The A Category In Our Study:
Brown-Forman, HEICO, Hubell and John Wiley are also rated “A”, but were not included in the study because we forgot to change the symbol from X-A or X-B to X/A or X/B as we moved between data bases. We do not believe the results are materially impacted by their omission.
| (AAP) | Advance Auto Part |
| (ABC) | AmerisourceBergen |
| (ABT) | Abbott Laboratori |
| (ADP) | Automatic Data Pr |
| (AIT) | Applied Industria |
| (AME) | AMETEK Inc. |
| (APD) | Air Products and |
| (ATNI) | Atlantic Tele-Net |
| (ATR) | AptarGroup Inc. |
| (BCPC) | Balchem Corporati |
| (BCR) | C.R. Bard Inc. C |
| (BDX) | Becton Dickinson |
| (BHB) | Bar Harbor Banksh |
| (BLL) | Ball Corporation |
| (BNS) | Bank Nova Scotia |
| (BRO) | Brown & Brown In |
| (CASS) | Cass Information |
| (CB) | Chubb Corporation |
| (CFR) | Cullen/Frost Bank |
| (CHE) | Chemed Corp |
| (CLC) | CLARCOR Inc. Comm |
| (CLX) | Clorox Company (T |
| (CNI) | Canadian National |
| (COL) | Rockwell Collins |
| (COST) | Costco Wholesale |
| (CPK) | Chesapeake Utilit |
| (CRR) | Carbo Ceramics I |
| (CSX) | CSX Corporation C |
| (DE) | Deere & Company C |
| (DOV) | Dover Corporation |
| (DRI) | Darden Restaurant |
| (EGN) | Energen Corporati |
| (ENB) | Enbridge Inc Comm |
| (ETR) | Entergy Corporati |
| (EXPD) | Expeditors Intern |
| (FAST) | Fastenal Company |
| (FDS) | FactSet Research |
| (FFIN) | First Financial B |
| (FLIC) | The First of Long |
| (FNMA) | FANNIE MAE |
| (GAS) | AGL Resources In |
| (GD) | General Dynamics |
| (GIS) | General Mills In |
| (GPC) | Genuine Parts Com |
| (HAS) | Hasbro Inc. |
| (HBNC) | Horizon Bancorp ( |
| (HCC) | HCC Insurance Hol |
| (HD) | Home Depot Inc. |
| (HEI) | Heico Corporation |
| (INGR) | Ingredion Incorpo |
| (IPAR) | Inter Parfums In |
| (ITW) | Illinois Tool Wor |
| (JWN) | Nordstrom Inc. C |
| (KMB) | Kimberly-Clark Co |
| (LKFN) | Lakeland Financia |
| (LMT) | Lockheed Martin C |
| (MCD) | McDonald’s Corpor |
| (MDT) | Medtronic Inc. Co |
| (NEE) | NextEra Energy I |
| (NOC) | Northrop Grumman |
| (NSC) | Norfolk Southern |
| (NWFL) | Norwood Financial |
| (OMI) | Owens & Minor In |
| (OZRK) | Bank of the Ozark |
| (PAYX) | Paychex Inc. |
| (PB) | Prosperity Bancsh |
| (PEI) | Pennsylvania Real |
| (PEP) | Pepsico Inc. Com |
| (PETM) | PetSmart Inc |
| (PH) | Parker-Hannifin C |
| (PNY) | Piedmont Natural |
| (RBC) | Regal Beloit Corp |
| (RGA) | Reinsurance Group |
| (RL) | Ralph Lauren Corp |
| (ROL) | Rollins Inc. Com |
| (ROP) | Roper Industries |
| (RTN) | Raytheon Company |
| (SHW) | Sherwin-Williams |
| (SJM) | J.M. Smucker Comp |
| (SNA) | Snap-On Incorpora |
| (SYBT) | S.Y. Bancorp Inc |
| (TMK) | Torchmark Corpora |
| (TUP) | Tupperware Brands |
| (UMBF) | UMB Financial Cor |
| (UNP) | Union Pacific Cor |
| (VFC) | V.F. Corporation |
| (VMI) | Valmont Industrie |
| (VSEC) | VSE Corporation |
| (WAB) | Westinghouse Air |
| (WAG) | Walgreen Co. Comm |
| (WEC) | Wisconsin Energy |
| (WTR) | Aqua America Inc |
| (WWD) | Woodward Inc. |
| (YORW) | The York Water Co |
The Bottom Line:
The data is clear — high quality is more desirable than the full S&P 500 index. High quality is more desirable than low quality if volatility, yield and yield growth are an issue.
There is no low quality S&P 500 fund that we are aware of, and it wouldn’t interest us if there was one.
There is a high quality S&P 500 fund (SPHQ) and it does interest us; however it has low volume (13,000 shares by mid-day today), while the S&P 500 ETF (SPY) has massive volume (77 million shares by mid-day today). Liquidity for many to most accounts makes any wholesale shift to SPHQ impractical. However, making sure that individual stocks are in the higher quality ranks is possible, and is a focus item for us
Given that the US economy is strong and the rest of the world is comparatively weak, high quality stocks with big international exposures [such as Caterpillar (CAT)] are not as attractive short-term, but are probably more attractive long-term as they capture revenue in developing economies, and their prices recover. A balance of each is probably a good idea now, depending on the time-frame and withdrawal needs of individual accounts.
By Richard Shaw
http://www.qvmgroup.com
Richard Shaw leads the QVM team as President of QVM Group. Richard has extensive investment industry experience including serving on the board of directors of two large investment management companies, including Aberdeen Asset Management (listed London Stock Exchange) and as a charter investor and director of Lending Tree ( download short professional profile ). He provides portfolio design and management services to individual and corporate clients. He also edits the QVM investment blog. His writings are generally republished by SeekingAlpha and Reuters and are linked to sites such as Kiplinger and Yahoo Finance and other sites. He is a 1970 graduate of Dartmouth College.
Copyright 2006-2013 by QVM Group LLC All rights reserved.
Disclaimer: The above is a matter of opinion and is not intended as investment advice. Information and analysis above are derived from sources and utilizing methods believed reliable, but we cannot accept responsibility for any trading losses you may incur as a result of this analysis. Do your own due diligence.
Richard Shaw Archive |
© 2005-2022 http://www.MarketOracle.co.uk - The Market Oracle is a FREE Daily Financial Markets Analysis & Forecasting online publication.