Canadian Dollar Analysis - Potential Emerging Trade
Currencies / Canadian $ Jul 05, 2013 - 09:59 AM GMTBy: Michael_Noonan
 The volume activity recently caught our eye in the Canadian dollar and prompted a closer
look. Our position is that by following the developing market activity, across a series of
time frames, a story about a potential trade should emerge. What follows are our rough
draft charts, without comments on them, beyond a few initial observations, going from one
time frame to another. All that matters is the conclusion drawn from them.
Trend is always of primary consideration, and the daily seems to be at cross-purposes for positioning in harmony with the trend. Acknowledged and considered.
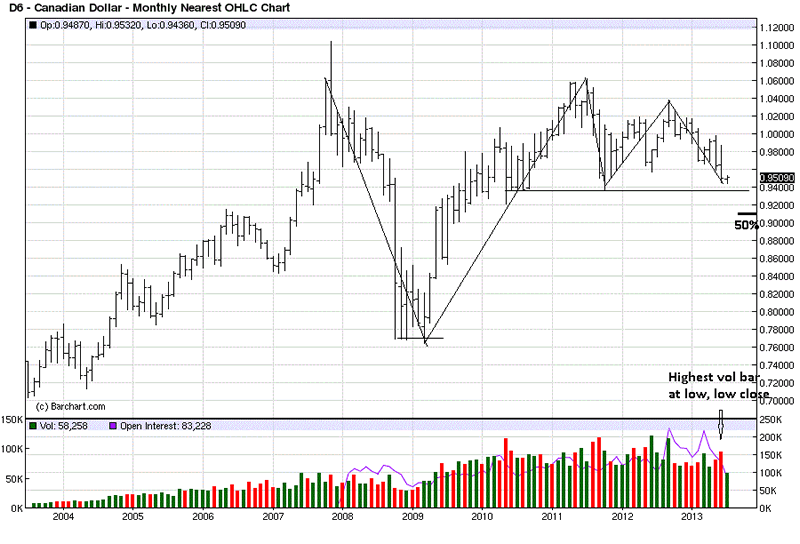
Had a 15 or 25 year span been chosen for the monthly chart, it would be clearer that this higher time frame is up. There is currently a sideways Trading Range, [TR], in progress, but note that it is well above a 50% retracement of the 2007 high to 2009 low range. A half-way retracement is a more general observation. When a correction holds above it, it is viewed as overall strength.
Red volume bars indicate when price closes lower than the previous one. The volume for June was the highest “down” volume in over a year, while at the same time, price is declining into an area of support from mid-2010 lows.
It is too soon to know if there will be downside follow-through, for July has just begun. For that possible answer, we look at the lower time frames.

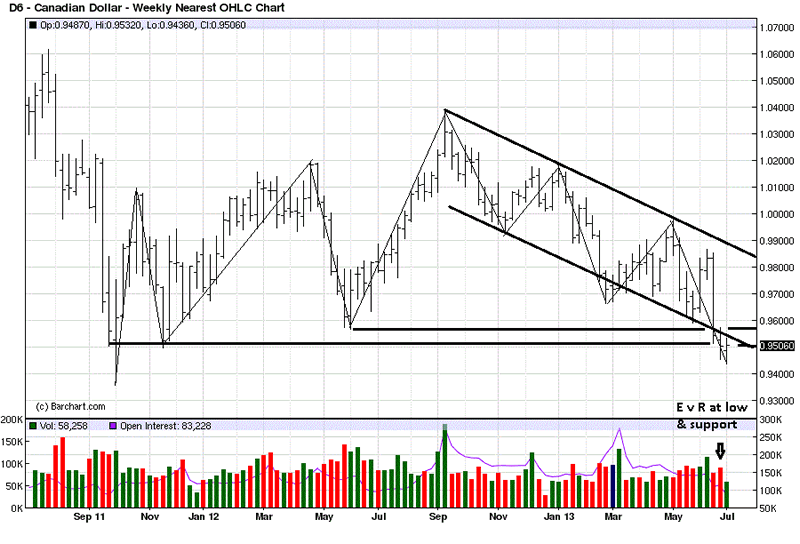
We are calling the weekly trend a non-trend, a TR within a larger up trend. At present, price has declined to the lower area of the TR, which should act as support. When we look at the increased volume lower as price is declining, a closer inspection shows the last down volume bar, second from right, was greater than the previous week’s down volume, third bar from right.
The contrast between the two is stark. The 3rd bar from right clearly shows downward ease of movement, and on the lowest volume in several weeks. We attribute that to a lack of demand with sellers in control.
The next bar down, 2nd from the end, has a stronger increase in volume, but the range of the bar was about one-third the size of the previous one, and price was right at important TR support. This bar tells us that buyers stepped in and stopped the effort of sellers cold. The increased selling effort did not result in a move lower. This price area is being defended, and the increased volume is from “smart money,” buying whatever weak- handed sellers and stops are offering.
Smart money buys low and sells high. Weak hands and speculators are always on the other side. It is not an accident that the character of developing market activity turned more positive at a point where support would be expected to hold. It is usually a smaller risk consideration to buy within the lower 25% of a TR.
Also, notice the time factor from the May 2012 low and rally to the September 2012 high, 14 weeks. Since that swing high, it has taken 42 weeks for price to reach the current swing low, if the current low holds. Price declines faster in a down market than rallies. We see the opposite within this developing TR. This leads us to conclude that it is accumulation in preparation to go higher. We can always be wrong, but the risk/reward consideration, while price is at obvious support, is favorable.

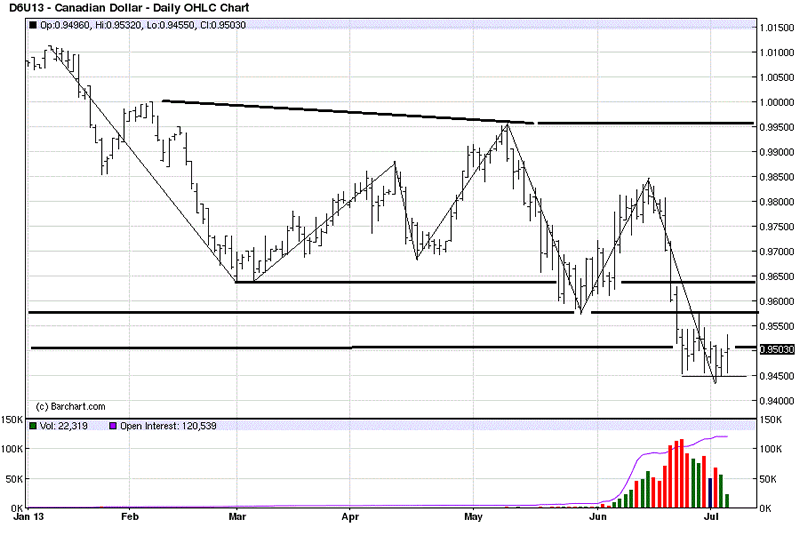
The two dark horizontal lines at the bottom are support from the weekly chart. What stands out on the daily, and in support of the two higher time frames just discussed, is the highest level of selling activity volume comes at the lows of the decline. If it were smart money selling, the volume would have been greater higher up, for smart money does not sell into/at support. The risk/reward does not make sense, at that level.
[This is the Sep contract, so volume from mid-June and earlier would have shown up on the June contract.]
Also worth noting is how price has since moved sideways and not lower, in response to the increased level of selling activity. A look at the composition of the current trading range confirmed the logic of the developing “story,” up to today’s activity.

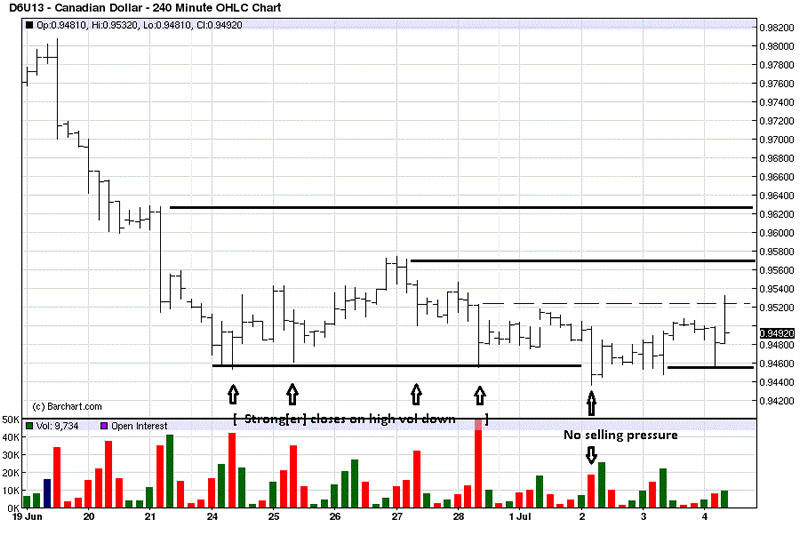
Professional forex traders use a 240 minute chart, primarily because it is a global market, and that time frame is more inclusive. High volume activity always bears watching to see what message market participants are sending.
The first four highest volume bars, [arrows], show closes lower than the previous bar, usually a form of selling, otherwise, the close would be higher. Look at where the closes are located for each of those “selling” bars: upper end to mid-range. On the highest volume activity for this lower-end developing TR, the close was mid-range, or a draw between buyers and sellers.
When price is at recent lows, who do you expect is in charge? Sellers. When the highest volume effort produces a draw, can it be said sellers are in control? Absolutely not. It was the effort from buyers that prevented sellers moving price lower, so from that point of view, it was more than a draw for buyers.
The last arrow down bar shows ease of movement lower, and in fact, price breaks the TR support from recent lows. Two things happen: 1. volume declined, which is a sign of less selling pressure, and 2. zero downside follow-though. Seven bars later, we see a rally on increased volume that erases the downside volume at the low.
Following the logic of developing market activity over four different time frames, each had a “story” to tell that gave credence to the next lower one, and the conclusion we draw is that price is undergoing accumulation, specifically at the lower support of the developing TR. If that turns out to be true, it makes sense to be long.
Hence, the buy recommendation today at 95.00. Stop at 94.22. From this point, we need to see future developing market activity to confirm this analysis. We could be timely; we could be early. There may still be another test lower, for anything can happen.
There is no question that buying within an established up trend is preferred and so much “easier.” Bernard Baruch once said, “You make money buying straw hats in January, [when nobody wants them."].

By Michael Noonan
Michael Noonan, mn@edgetraderplus.com, is a Chicago-based trader with over 30 years in the business. His sole approach to analysis is derived from developing market pattern behavior, found in the form of Price, Volume, and Time, and it is generated from the best source possible, the market itself.
© 2013 Copyright Michael Noonan - All Rights Reserved Disclaimer: The above is a matter of opinion provided for general information purposes only and is not intended as investment advice. Information and analysis above are derived from sources and utilising methods believed to be reliable, but we cannot accept responsibility for any losses you may incur as a result of this analysis. Individuals should consult with their personal financial advisors.
Michael Noonan Archive |
© 2005-2022 http://www.MarketOracle.co.uk - The Market Oracle is a FREE Daily Financial Markets Analysis & Forecasting online publication.


