What the PE Ratio can tell us about the Future Stock Market Direction
InvestorEducation / Corporate Earnings Feb 27, 2007 - 12:20 AM GMTBy: Hans_Wagner
S&P 500 earnings are on track for a 20% gain compared to last years 3 rd quarter. Next quarter earnings should rise about 11%, marking the fifteenth straight quarter of a double-digit gain. Along with the excellent earnings performance we have experienced dramatic strength in the major averages as well. The DJIA is at all time highs and the S&P 500 is above 5 year highs.
The outlook for continued good performance in both earnings and the indices remains strong. Given this positive outlook, I thought it might be appropriate to see if stock valuations are getting ahead of themselves by looking at current and past PE ratios.
First, just to be sure we all know what is meant by the PE ratio. It is a ratio of a company's current share price compared to its per-share earnings. Calculated as:
![]()
This means if the value per share goes up faster than the earnings per share, then the PE ratio goes up. The higher the PE ratio the more lofty the valuations and the greater the potential for the market to overheat, resulting in a pull back. This happened in 2000. If earnings move up faster than the value per share, then the PE ratio will decline. This happens when the market is transitioning from an overbought situation even as earnings increase. The point is that both stock prices and earnings drive the PE ratio.
With most all of the S&P 500 companies having reported their earnings, it turns out that the PE ratio for the S&P 500 for the 3 rd quarter of 2006 is 17.5. This is still above the average of 16, though it is trending down. The table below displays the PE ratio for the S&P 500 for the last 9 quarters. As you can see it has fallen from 20.5 in the 3 rd quarter of 2004 to 17.5 in the latest quarter. So even with the nice move up in the S&P 500, the PE ratio has fallen, driven by double digit earnings growth.
S&P 500 PE Ratio |
||||||||
Q3 2004 |
Q4 2004 |
Q1 2005 |
Q2 2005 |
Q3 2005 |
Q4 2005 |
Q1 2006 |
Q2 2006 |
Q3 2006 |
20.5 |
20.3 |
20.1 |
19.5 |
18.4 |
18.1 |
17.8 |
17.8 |
17.5 |
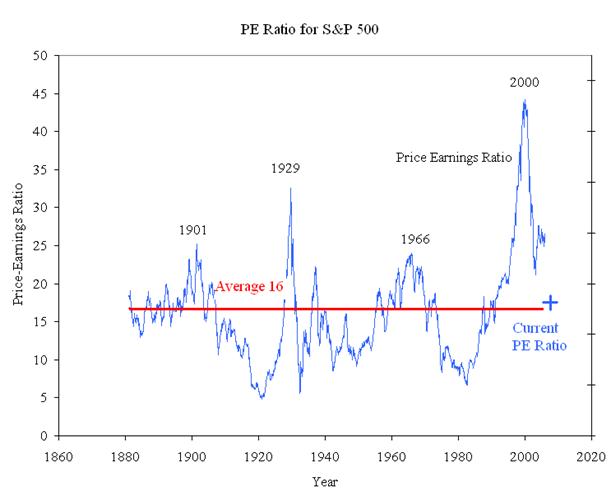
Now let's look at the bigger picture. Below is a chart from Robert Shiller, a Yale economics professor and author of Irrational Exuberance: Second Edition ![]() . First, notice that the PE ratio is a mean reverting index, meaning that when it moves away from the average it will eventually move back to average. In fact, it normally goes past the average in a cyclical motion. I also put a plus sign (+) indicating where the PE is as of the 3rd quarter 2006 (17.5). The trend is down from a high in 2000. If history repeats itself, as it usually does, we can expect the S&P 500 PE ratio to penetrate 16 and then go lower, with 10 a possibility in the next several years. In order for this to happen earnings will have to go up over 70% with stock prices remaining essentially flat, or stock prices would have to go down over 40% with earnings remaining flat. Those are scary thoughts.
. First, notice that the PE ratio is a mean reverting index, meaning that when it moves away from the average it will eventually move back to average. In fact, it normally goes past the average in a cyclical motion. I also put a plus sign (+) indicating where the PE is as of the 3rd quarter 2006 (17.5). The trend is down from a high in 2000. If history repeats itself, as it usually does, we can expect the S&P 500 PE ratio to penetrate 16 and then go lower, with 10 a possibility in the next several years. In order for this to happen earnings will have to go up over 70% with stock prices remaining essentially flat, or stock prices would have to go down over 40% with earnings remaining flat. Those are scary thoughts.

The chart above was derived from Robert Shiller is the Stanley B. Resor Professor of Economics at Yale and author of Irrational Exuberance: Second Edition ![]() . Robert Shiller's web site I added the average line and the plus sign (+) indicating the 3 rd quarter 2006 PE ratio.
. Robert Shiller's web site I added the average line and the plus sign (+) indicating the 3 rd quarter 2006 PE ratio.
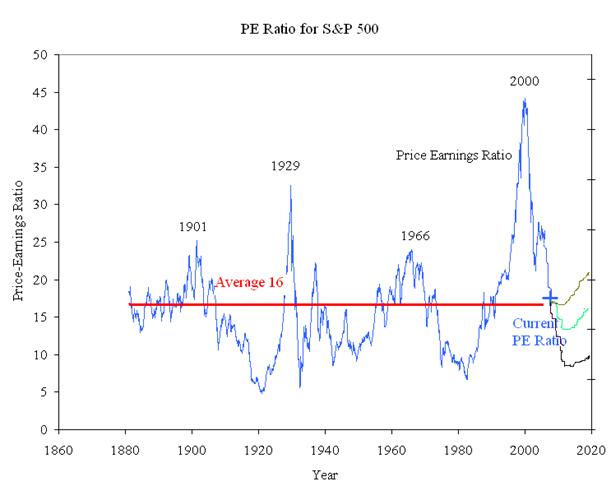
So what does this mean to investors? There are many possible scenarios, however, lets briefly look at three. First, we continue on the same PE ratio trend with earnings growing faster than the valuation of the S&P 500. The ratio will hit 16 and then fall below that over the next 5 to 8 years. Should earnings growth slow down then the rise in stock prices will have to slow down as well, possibly going flat to down. This is the green line option. Second option, the PE ratio falls to 10 in the next 2 years. This implies a rapid drop in the price of stocks. This is the black line option. Third, the PE ratio reaches the average of 16 and then moves back up as valuations increase. Stock prices either maintain their current levels or move higher. When the ratio hits 16 the market starts a new bull market and valuations grow faster than earnings. This is the brown line option.

The direction the PE ratio takes will have a significant impact on investors. While it would be great to accurately predict the correct scenario, we need to recognize that the probability of correctly making this prediction is low. We are better served to be prepared to accept any likely scenario as the market shows itself using the PE ratio trend as one of the important long term indicators that needs to be monitored. As such we will revisit what is happening to the S&P 500 PE ratio and how we use the insight it offers. For now expect the ratio to fall to its long term average of 16 form the current average of 17.5.
This will require earnings to continue to grow faster then stock prices over the next several quarters. Current forecast are for 11% earnings increase in the 4 th quarter of 2006. With the S&P 500 up 9.6% so far this year, that doesn't leave much room for prices to move higher and still have a falling PE ratio. We are in the best time of the year for stock price performance, so a small expansion in the PE ratio is not a move away from the long term trend. In any case I do not see a significant increase in stock price valuation for now. We will need to make another assessment in 3 months.
By Hans Wagner tradingonlinemarkets.com
My Name is Hans Wagner and as a long time investor, I was fortunate to retire at 55. I believe you can employ simple investment principles to find and evaluate companies before committing one's hard earned money. Recently, after my children and their friends graduated from college, I found my self helping them to learn about the stock market and investing in stocks. As a result I created a website that provides a growing set of information on many investing topics along with sample portfolios that consistently beat the market at http://www.tradingonlinemarkets.com/
© 2005-2022 http://www.MarketOracle.co.uk - The Market Oracle is a FREE Daily Financial Markets Analysis & Forecasting online publication.
Comments
|
narendra
20 Jul 07, 20:45 |
P.E.Ratio.
I have never read such an excellent article.I like to know is there any book writtern by you on this subject.Pl.inform me.Thanks. |


