


Gold Right on the Doorsteps of a Big Rally
Commodities / Gold and Silver 2013 Aug 14, 2013 - 09:52 AM GMTBy: Clive_Maund

 All the pieces are in place for a major uptrend in gold to begin right away, and it appears to be starting as this is being prepared. The Commercials have cleared out virtually all of their short positions, for a massive profit of course, meaning that the slate is wiped clean for the game to start over anew. Public opinion and sentiment towards gold remains rotten, which is exactly what you expect to see at a major low, with the investing public at large, having been duly "educated" by the mainstream media, harboring a negative attitude to gold and if anything inclined to short it. Lastly, seasonal factors couldn't be better - August and September are traditionally the best months of the year for gold.
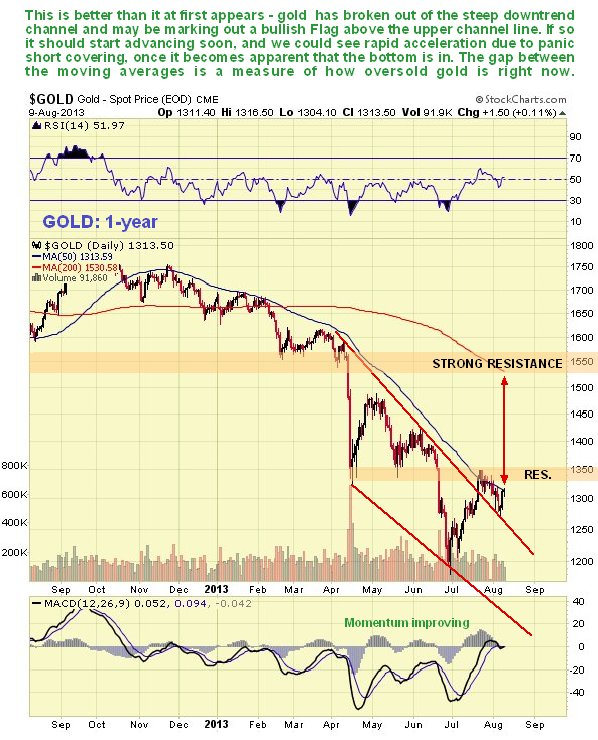
On its 1-year chart we can see that gold had already broken out of its steep downtrend in mid-July, since which time it has been held in check by its falling 50-day moving average, which is now starting to flatten out, so that a bull Flag appears to have formed as the price retreated back along the top of the trendline that it had earlier broken above. This Flag implies another upleg, which appears to have started this morning, and this uptrend could really gain traction soon if the price breaks above the nearby resistance shown, given the huge speculative short positions that have built up and the consequent potential for massive short covering. The gap between the 50 and 200-day moving averages provides a measure of how oversold gold is. Of course, breaking above the strong resistance at the earlier major support in the $1550 area that failed back in the Spring will be a tough nut to crack, but we will have to see how gold shapes up approaching it, in order to assess the chances of an early breakout above this key level.
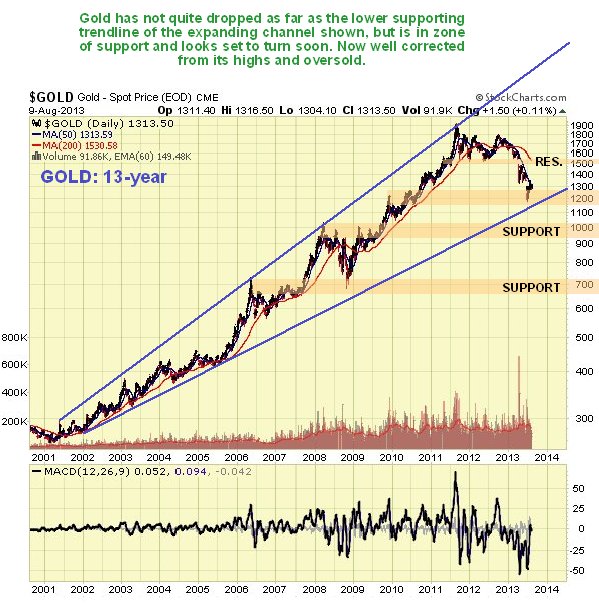
The long-term 13-year chart for gold shows that it is at a good point to turn up again, as it has retreated back almost to the important long-term supporting trendline shown, and also into the zone of support shown. This chart makes clear that gold is still in a bullmarket.
The latest gold COT chart is very bullish indeed. The uptick in Commercial short and Large Spec long positions last week is nothing to worry about - on the contrary it is thought to indicate the start of another bull cycle for gold which will see positions on both sides expand again as gold ascends.

The long-term gold COT chart shows an extraordinarily bullish setup for gold, with the Commercials having almost totally cleared out their short positions to a historic low, for a huge profit of course, and the habitually wrong Large and Small Specs having reduced their long positions to a very low level. All this shows that the game has been reset prior to another major uptrend starting in gold.
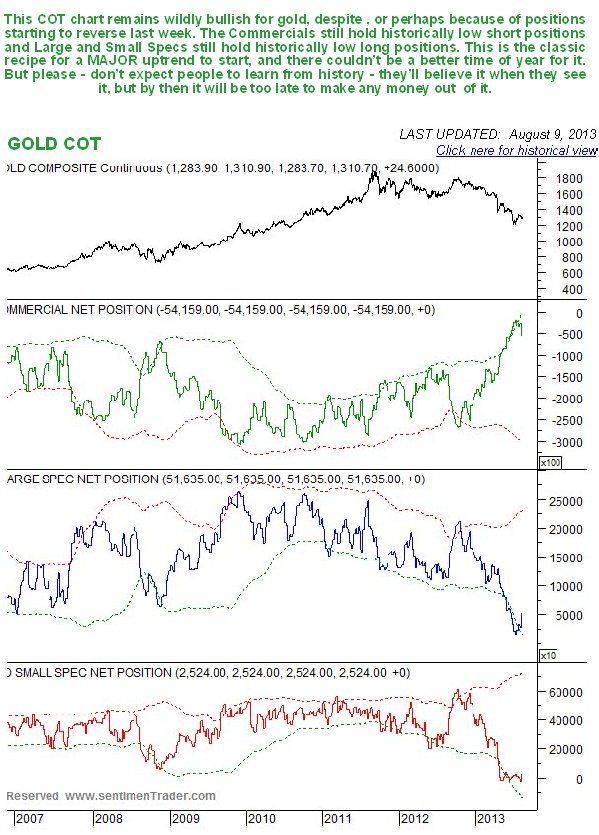
Chart courtesy of www.sentimentrader.com
The Hulbert Gold Sentiment chart that we have used in the past is no longer available on www.sentimentrader.com the reason given being "Due to a request from Hulbert Financial Digest, the publishing of this chart has been temporarily suspended." Maybe Big Money has been leaning on people - after all they wouldn't want ordinary investors having access to information that might enable them to make decisions that turn them from habitual losers into winners. Perhaps in the future, if you want any useful charts, you will have to compile all the data yourself and make them from scratch, assuming the data itself isn't rigged, of course. By that time I will be retired and able to laugh about it all - unless I follow Richard Russell's example.
The latest Public Opinion chart shows that the public still hold a very low opinion of gold, and that has to be bullish.
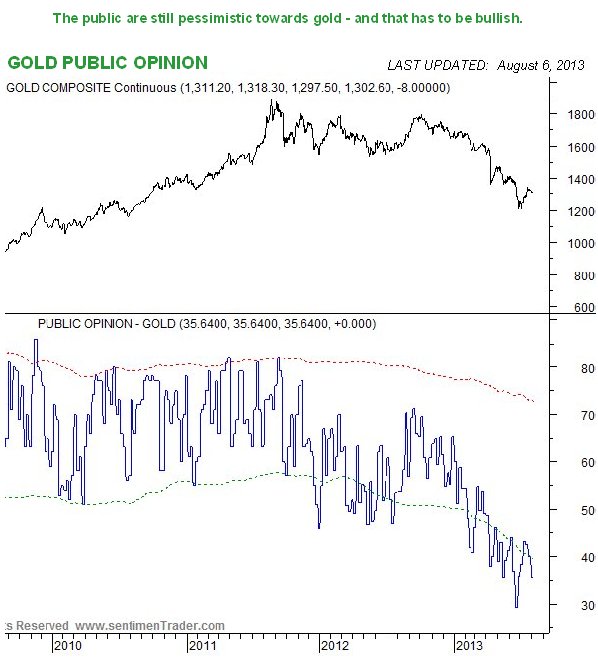
Chart courtesy of www.sentimentrader.com
The Rydex traders are upholding their time honored tradition of providing an excellent contrary indicator - keep up the good work lads! ...
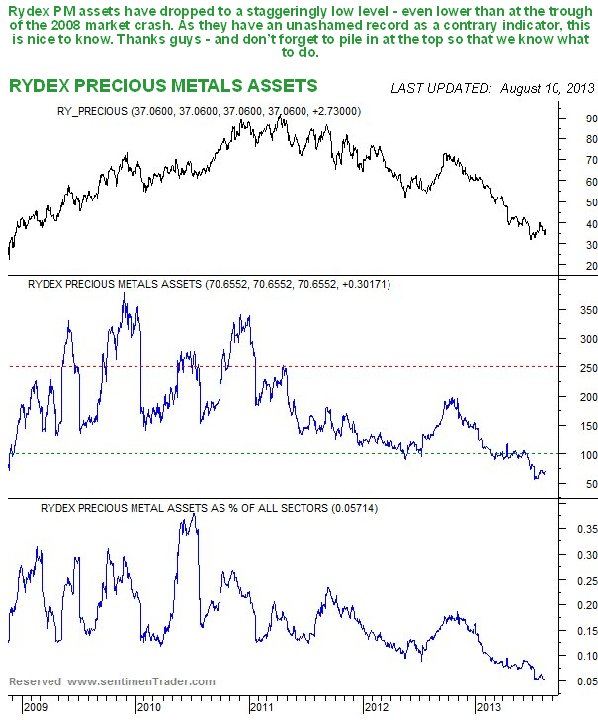
Chart courtesy of www.sentimentrader.com
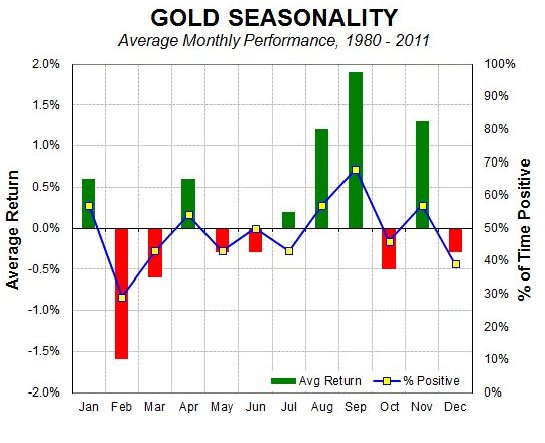
The gold seasonal chart is most encouraging as it shows that we have arrived at the most seasonally bullish time of year for gold. With the middle of August approaching it's high time gold starting rallying - and this morning it is.This positive seasonality continues through to mid - end of September.
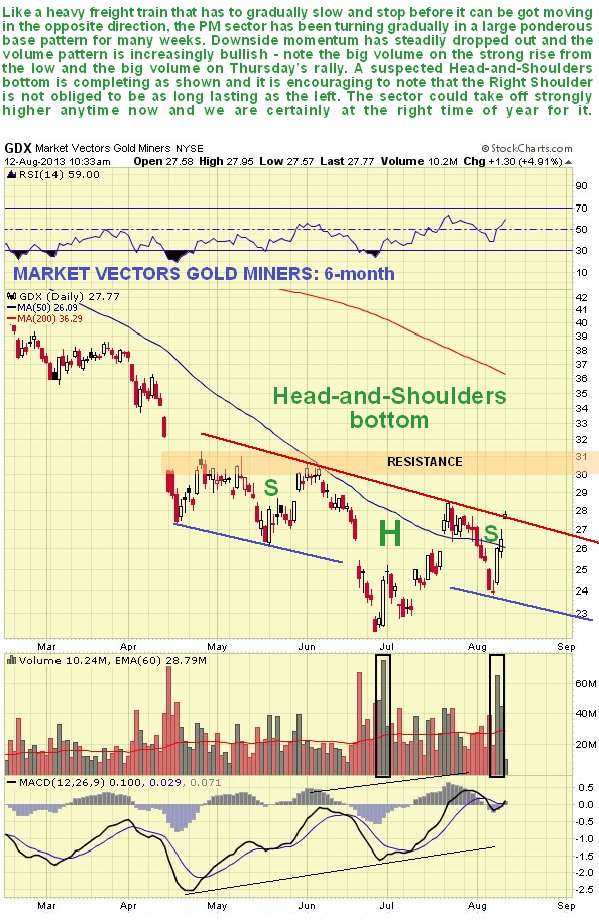
A glance at the chart for the GDX, which we examined on the site last week in some detail, shows that something is brewing. Bearing in mind that stocks commonly lead gold, it is most encouraging to see that a basing pattern started to form in stocks as far back as the low point of the dramatic plunge in mid-April. The pattern that has been building in the GDX appears to be a downsloping Head-and-Shoulders bottom, which is more bullish than the normal flat-topped pattern, because the downward slope fools the majority of investors into thinking that a relentless bearmarket is in process - they usually notice that the market is basing. As we can see downside momentum has been decreasing as this pattern has evolved, while upside volume has been increasing, with 2 big white.
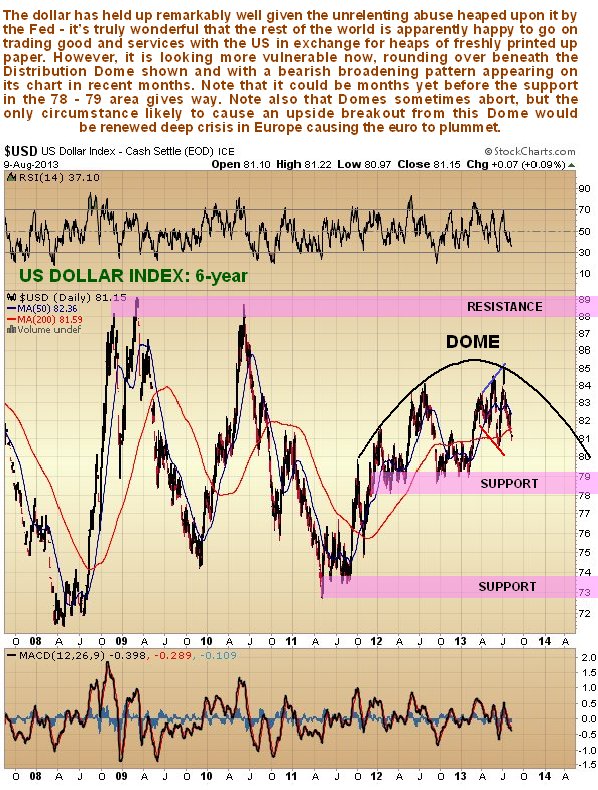
What about the dollar? The dollar's underlying plight due to the Fed's strident efforts to render it ultimately worthless has been masked by the mess and mayhem in Europe causing funds to head west and prop it up as the lesser evil. If that stops there could be a grim day of reckoning ahead for the dollar, particularly if other countries around the world start to grasp that it's not particularly smart to swap good and services for piles of newly printed and intrinsically worthless paper, be they dollars or Treasuries. The days of being able to rely on an endless stream of foreign fools to supply something for nothing may be numbered.
Thus it is interesting to observe that the dollar has been rounding over gradually beneath a "Distribution Dome" on its chart, that developed following the sharp rally in mid-late 2011. While these Domes sometimes abort, that is to say the price breaks out upside from them, the only circumstance likely to cause that would be a sudden deepening of the crisis in Europe. While that is possible, the chart looks bearish at this point, especially as a bearish broadening formation or bullhorn pattern has developed on the chart in recent months. Here we should note that were the dollar to rally because of more strife in Europe, it wouldn't stop gold from rallying - it is not generally realized that the dollar and gold sometimes rise in tandem. We should also note that if the dollar does now weaken, it is likely to be some months before the significant support in the 78 - 79 area gives way.
Ted Butler has recently written an article saying that J P Morgan have, over a period of many months, wound down a giant short position in gold, at a gigantic profit of course, and now replaced it with a giant long position. While we are of course delighted for J P Morgan, and its illustrious leaders, we are equally pleased that, if what Butler says is true, gold is heading a lot higher, because what J P Morgan (and Goldman Sachs) want, they usually get. Ted Butler's frequent use of the term "corner" in this article, implying - perish the thought - that the market might be manipulated, is a sign that Butler may have been a football player in his younger days.
Meanwhile Adam Hamilton has written a timely article some weeks back highlighting the potential for a massive short squeeze in gold. While it helps to take an acid tab an hour or so before looking at his charts, he presents a convincing case, and it certainly looks like a blistering rally is not far over the horizon. This is good news for bulls, as it means that gold should have less trouble taking out the strong resistance at the April breakdown point than would otherwise be the case.
In conclusion we appear to be right on the doorstep of the next major uptrend in gold, silver and the PM sector, which promises to be really big, like the late 70's only a lot more spectacular. Rising interest rates won't stop it - on the contrary rising rates will feed it just as in the late 70's because rising rates won't attract people to bonds if their price is collapsing. Most investors will miss out on it, as usual, as a result of being burned by the preceding correction, and worries about that downtrend continuing, played up by the still negative media. They will turn up in droves many months down the road when prices will be much higher.
We have already looked at the bigger gold and silver stocks on the site, and the main leveraged ETFs. Soon we will be looking at options strategies involving the main ETFs and big stocks, designed to leverage gains from the uptrend. This is, believe or not, a much safer and more reliable way of achieving performance than dabbling in dodgy juniors, which or may not partake in the rally, and can collapse at any time, almost without warning.
By Clive Maund
CliveMaund.com
For billing & subscription questions: subscriptions@clivemaund.com
© 2013 Clive Maund - The above represents the opinion and analysis of Mr. Maund, based on data available to him, at the time of writing. Mr. Maunds opinions are his own, and are not a recommendation or an offer to buy or sell securities. No responsibility can be accepted for losses that may result as a consequence of trading on the basis of this analysis.
Mr. Maund is an independent analyst who receives no compensation of any kind from any groups, individuals or corporations mentioned in his reports. As trading and investing in any financial markets may involve serious risk of loss, Mr. Maund recommends that you consult with a qualified investment advisor, one licensed by appropriate regulatory agencies in your legal jurisdiction and do your own due diligence and research when making any kind of a transaction with financial ramifications.
Clive Maund Archive |
© 2005-2022 http://www.MarketOracle.co.uk - The Market Oracle is a FREE Daily Financial Markets Analysis & Forecasting online publication.