


U.S. Stock Markets Still Remaining Bullish
Stock-Markets / Stock Markets 2013 Aug 19, 2013 - 09:02 AM GMTBy: Donald_W_Dony

Though most of the world's stock indexes have been trading flat over the last 12 months, the S&P 500 has continued to advance with little more than a minor pullback. The rationale for this bullish tone maybe questioned, but there is no denying the fact that the U.S. index is still in a strong bullish trend.
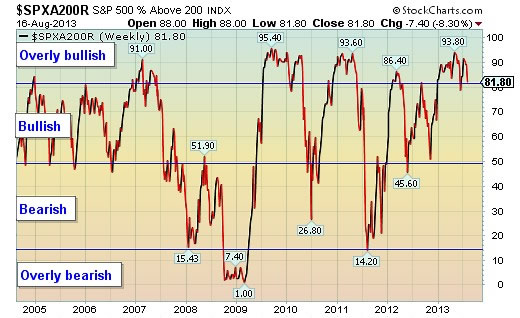
Technically, the S&P 500 has been at an overly bullish level since January 2013.
During the last eight months, there has been between 80 percent and 93 percent of the stocks within the U.S. index trading above their long term 200 day moving averages.
Historically, major corrections only develop when the percentage of stocks above their 200 day m/a is less than 50% and that the percentage remains below this level (50%) for at least 3-4 months.
The readings during late 2007 and early 2008 are a good example of the percentage levels that are required for a major correction.
Currently, over eight-out-of-10 stocks on the S&P 500 are trading over their 200 day m/a. This overly bullish reading suggests that the rise in the S&P 500 is not over.
Bottom Line: The high percentage of stocks that are trading over their long term 200 day moving average implies that the bull run for the S&P 500 will continue and that higher levels should be expected.
The present level also suggests that any major corrections will likely not occur in Q4. As history has shown that it takes at least 3-4 months of a less than 50 percent reading before a substantial decline can begin.
Additional market analysis is in the August newsletter.
By Donald W. Dony, FCSI, MFTA
www.technicalspeculator.com
COPYRIGHT © 2013 Donald W. Dony
Donald W. Dony, FCSI, MFTA has been in the investment profession for over 20 years, first as a stock broker in the mid 1980's and then as the principal of D. W. Dony and Associates Inc., a financial consulting firm to present. He is the editor and publisher of the Technical Speculator, a monthly international investment newsletter, which specializes in major world equity markets, currencies, bonds and interest rates as well as the precious metals markets.
Donald is also an instructor for the Canadian Securities Institute (CSI). He is often called upon to design technical analysis training programs and to provide teaching to industry professionals on technical analysis at many of Canada's leading brokerage firms. He is a respected specialist in the area of intermarket and cycle analysis and a frequent speaker at investment conferences.
Mr. Dony is a member of the Canadian Society of Technical Analysts (CSTA) and the International Federation of Technical Analysts (IFTA).
Donald W. Dony Archive |
© 2005-2022 http://www.MarketOracle.co.uk - The Market Oracle is a FREE Daily Financial Markets Analysis & Forecasting online publication.