


Stock Market Intermediate Decline?
Stock-Markets / Stock Markets 2013 Aug 20, 2013 - 10:21 AM GMTBy: Andre_Gratian

 Current Position of the Market
SPX: Very Long-term trend - The very-long-term cycles are in their down phases, and if they make their lows when expected (after this bull market is over), there will be another steep decline into late 2014. However, the severe correction of 2007-2009 may have curtailed the full downward pressure potential of the 40-yr and 120-yr cycles.
Intermediate trend - SPX and some other indices have formed a H&S top which was confirmed with last week's sell-off. A back-test of the neckline is possible over the near-term.
Analysis of the short-term trend is done on a daily basis with the help of hourly charts. It is an important adjunct to the analysis of daily and weekly charts which discusses the course of longer market trends.
Daily market analysis of the short term trend is reserved for subscribers. If you would like to sign up for a FREE 4-week trial period of daily comments, please let me know at ajg@cybertrails.com
INTERMEDIATE DECLINE?
Market Overview
A week ago, I mentioned that the market was at a decision point. A Head & Shoulders pattern appeared to be forming on the SPX while the breadth indicator was slumping badly. However, it was not a uniform picture with evident strength in the NASDAQ 100 and the Russell 2000 holding back. Last week decided in favor of the downtrend with the SPX breaking below the H&S neckline decisively and closing 30 points lower by Friday. It does seem that a somewhat incoherent intermediate decline is underway. The DJIA is clearly the weakest index, while QQQ is still reluctant to confirm its downtrend.
Structure: For the DOW and SPX, at least, it does appear that major wave 4 is underway. If so, one would expect the correction to develop in a broad A-B-C pattern.
Breadth: As is normally the case, weakness first appeared in the daily breadth indicator. By the end of the week, it was sufficiently oversold to warn of an imminent counter-trend rally.
P&F and Fibonacci projections: SPX has already met several minor P&F projections and could decide to take a break at any time. However, the mid-course target of wave A is probably still several points lower.
Support/resistance zones: Strong support exists between 1630 and 1640. While it should eventually be penetrated, it may first initiate a counter-trend rally.
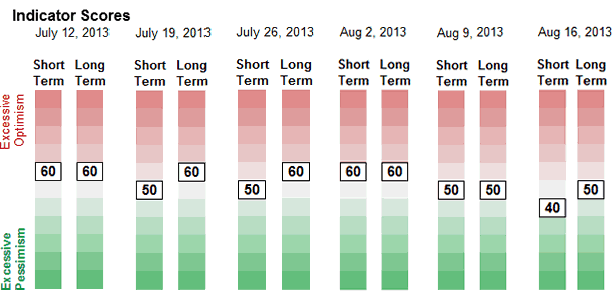
Sentiment: the SentimenTrader long term indicator is holding at a neutral 50. It will undoubtedly dip lower by the time the decline has completed its course.
Chart Analysis
We are going to analyze the Daily SPX Chart (courtesy of QChart). You could not find a better H&S pattern than the one which developed over the past few weeks. After the right shoulder formed in about the same amount of time as the left, breaking the neckline came quickly. The question is whether or not there will be the traditional rally back to the neckline before the market continues its decline.
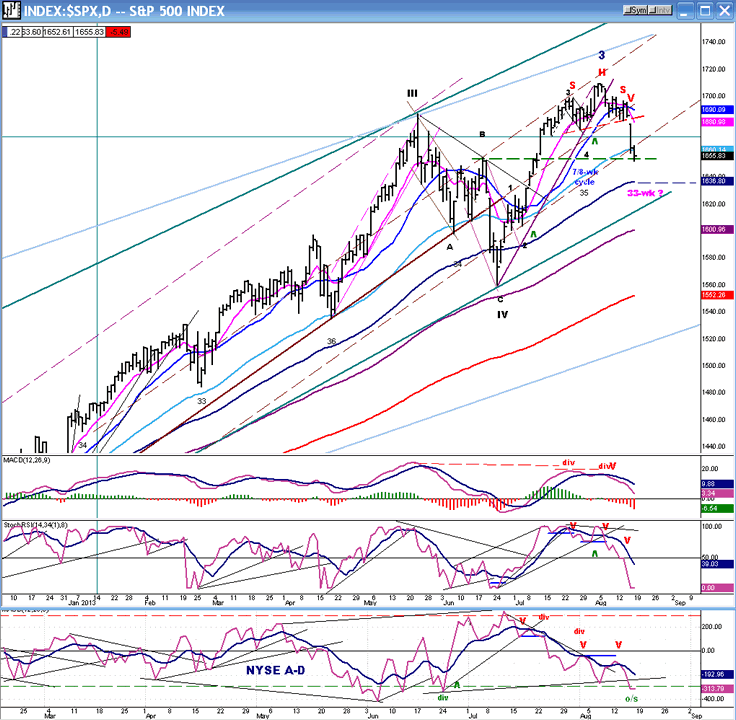
It's possible! I had suggested that the top could be the result of the 33-wk cycle whose low is ideally due on Monday, and it's probably no coincidence that the top came a couple of weeks before that date. If, in fact, the cycle does make its low then, it could promote a rally strong enough to get back up to the neckline. A trend line from the low of intermediate wave IV to the bottom of minor 4 was broken and started the downtrend. After a few days of trading sideways, the right shoulder was formed and SPX was ready to start its decline in earnest. Note that an extension of the former trend line from 1343 also marked the starting point of the decline when it was broken.
By Thursday, the down-trending index had progressed to the level of the 55-DMA (light blue) and of an internal (dashed) trend line where it tried to hold; but the downside momentum was still too great and Friday SPX reluctantly dropped a little lower. That brought it to a support point created by the 6/18 peak. It is very likely that the combined support caused by these three conditions, as well as the ideal time frame for the low of the 33-wk cycle will be enough to establish the first stopping point of the decline and start a rally which could take SPX back up to its H&S neckline. The Point & Figure chart shows that there is enough accumulation in the sloping deceleration pattern (better seen on the hourly chart) which started at 1659 to reach that level with a counter-trend rally.
Weakness in the market began to appear early in the A/D indicator while the left shoulder was forming, and continued to increase throughout the entire H&S formation. The momentum indicators did not reverse until well into that process. The A/D oscillator and the SRSI have reached the bottom of their normal ranges while the MACD is only now reaching the zero line. This makes the market ripe for an oversold rally, especially after the flagrant positive divergences which have developed in the hourly breadth and momentum indicators. If Friday did not find a temporary low point, Monday surely will.
It should also be noted that the ultimate confirmation of an important decline will not come until the MACD crosses into negative territory.
The Hourly Chart clearly shows the precision with which the neckline was broken. After bouncing from it five times, and after a series of descending tops, it was time for the SPX to break below the neckline -- which it did with the assistance of a few news triggers on Thursday morning (a normal occurrence).
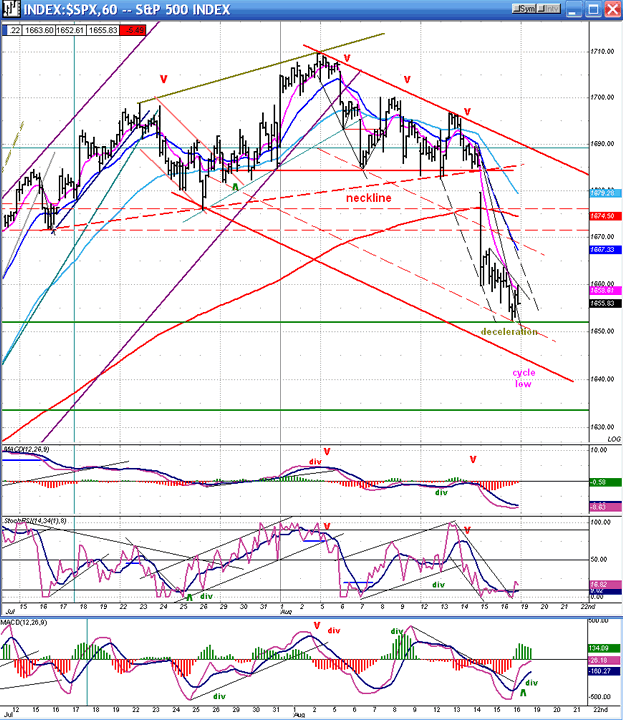
By the end of the day, the process of deceleration had already started with early buyers stepping in, but they continued to be overwhelmed by sellers until the Friday close. The bottoming cycle is undoubtedly a factor in the continuing selling wave, as well as the realization that something more than a simple consolidation may have started.
At the same time, the obvious signs that we were reaching a near-term low was causing the supply/demand equation to shift rapidly, slowing the speed of the decline as well as becoming apparent in the number of issues traded. Look at how the bottom (A/D) indicator started to rise from Friday's opening and became almost positive by the close. Also, the SRSI started to lift from its low near the close after breaking out of a down-channel. These are the green flags which herald the arrival of a price rally. If there is a little spill-over of selling on Monday morning, we could see three or four more points on the downside before a reversal takes place.
Cycles
It was very kind of the 33-wk cycle to cooperate, especially if it continues to do so by producing a rally to the neckline - or thereabouts - after it makes its low.
Afterwards, the decline should continue into the next 7/8-wk cycle low which is due in the week of 9/16.
Breadth
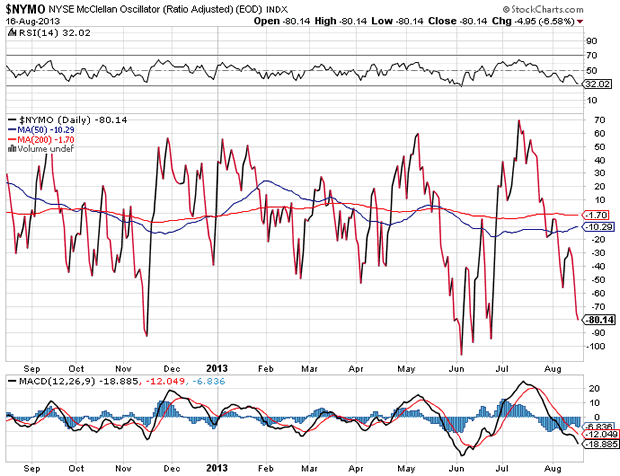
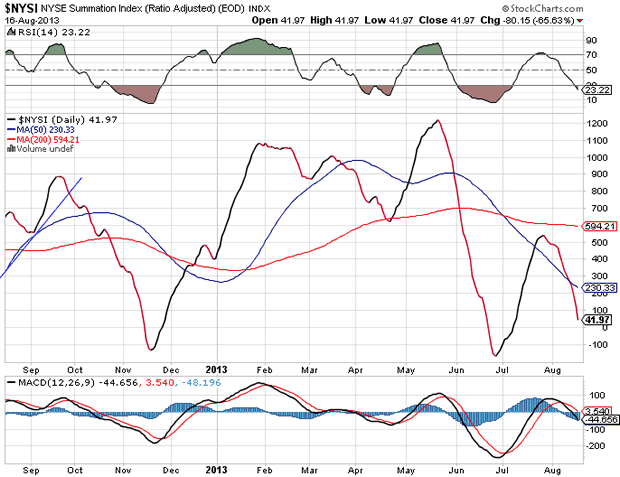
The McClellan Oscillator and Summation Index appear below (courtesy of StockCharts.com). The severe negative divergence which formed in the Summation Index was a strong indication that the market was ready to reverse. Now, we can see that the McClellan Oscillator has returned to an oversold level. As soon as it shows some positive divergence, we should be prepared for a good rally.
Sentiment Indicators
In the SentimenTrader (courtesy of same), the short-term has dropped to its lowest level in 7 weeks. That could be another indication that an oversold rally is due. The long term is at neutral and will undoubtedly drop lower before we come to the end of the decline.
VIX
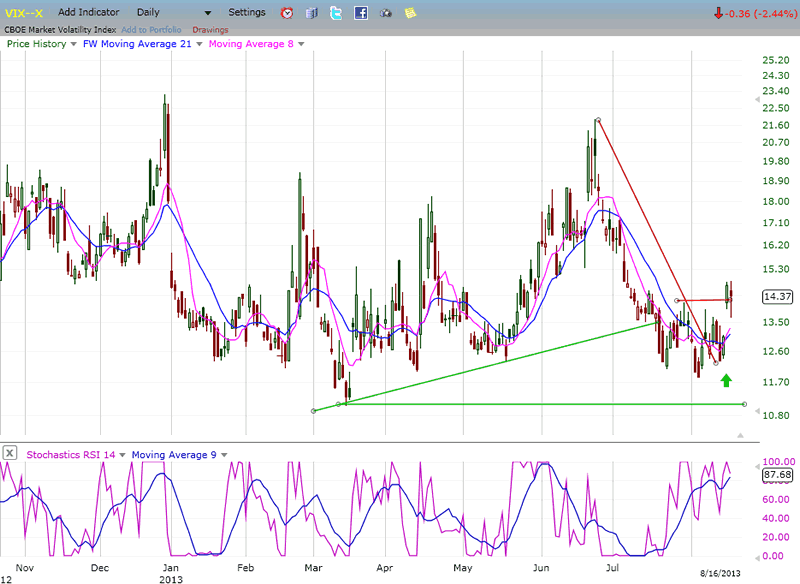
The velocity index has finally -- and only reluctantly -- confirmed the beginning of a market correction. Although it remained above its March low while the indices were making new highs - a warning that a correction was due - it did not give such a signal over the short-term. Also, it has barely cleared its former short-term peak while the SPX and (especially) the DOW have demonstrated much greater relative weakness.
Perhaps I am reading too much into it, but since the VIX action could be interpreted as a weak confirmation of the overall market weakness, it may be a warning that we are about to have a better rally than most expect.
XLF (Financial SPDR)
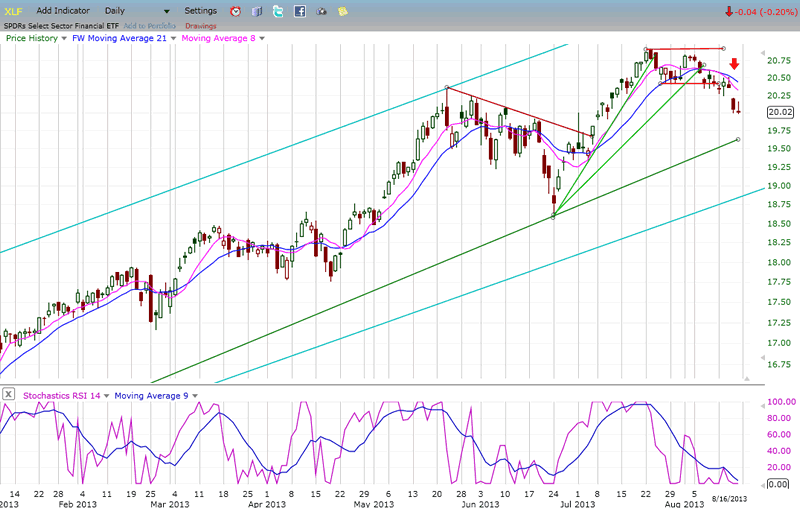
XLF did warn of a top by displaying some negative divergence in its refusal to make a new high along with the SPX. It also led the decline by breaking its support level a few days before SPX did. By Friday, however, it started to display less weakness than SPX, adding to the perception that a counter-trend rally could be imminent.
BONDS
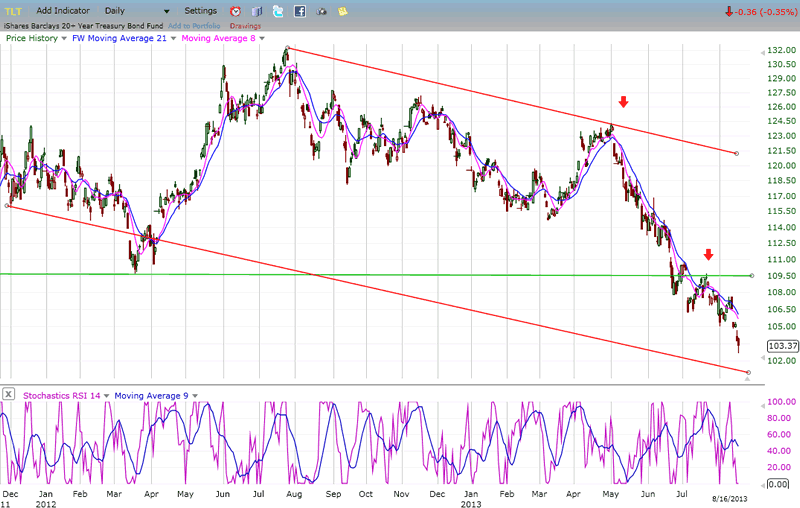
TLT continues its long-term decline. After pausing briefly in the area of an important support line, it appears that the index is starting another leg down as well as expanding its bearish long-term channel.
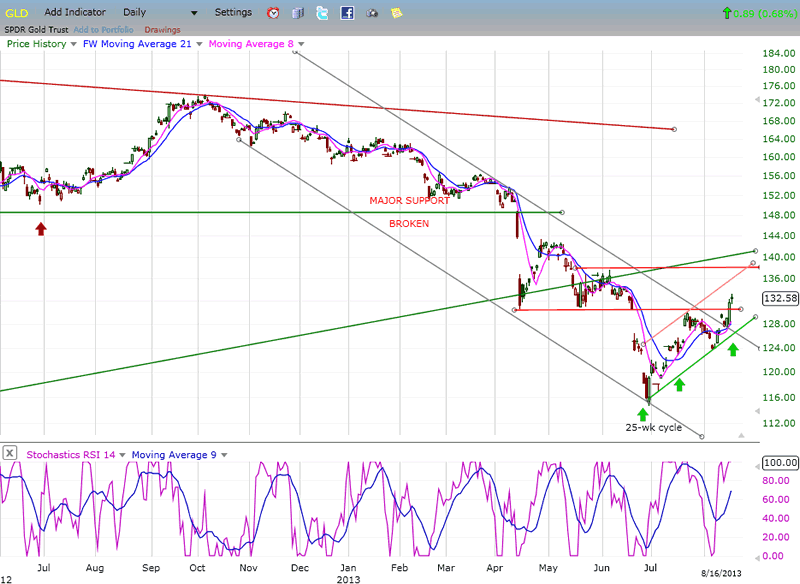
GLD (ETF for gold)
Propelled by the rising phase of its 25-wk cycle and an oversold condition, GLD has managed to break out of its intermediate bearish channel, but how much farther it can continue this rally is questionable. It has entered a zone of overhead resistance which is likely to stop its advance. Until it proves otherwise, GLD is probably only re-adjusting the angle of its long-term downtrend.
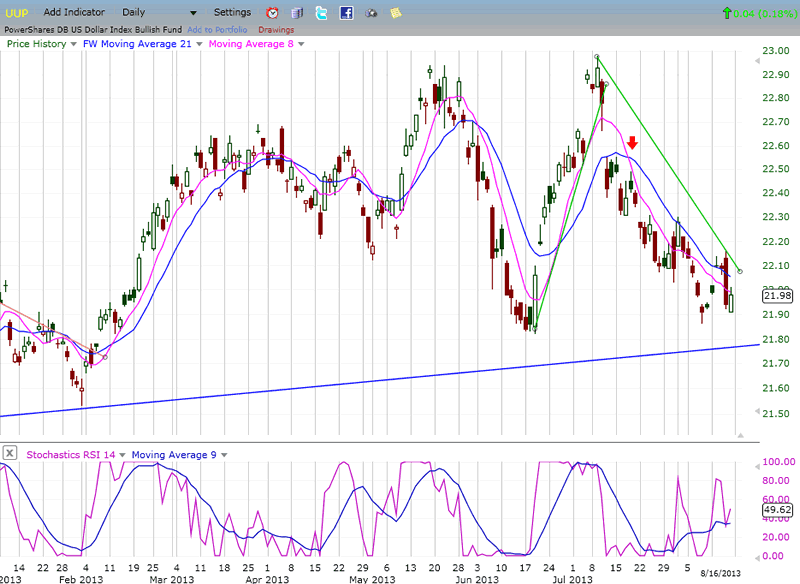
UUP (dollar ETF)
Since it bottomed in early 2011, UUP has undergone a series of price fluctuations in a fairly narrow range. The entire process looks as if it is forming a long-term base which will eventually resolve to the upside -- when the Fed ends its easy-money policy. Over the short-term, some deceleration is showing in the downtrend which started at 23, but more base-building action may be required before the next uptrend can be established.
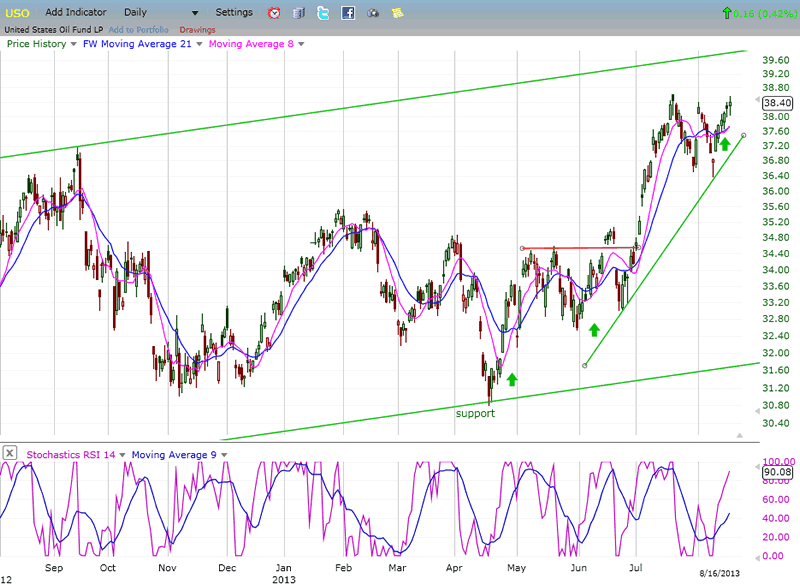
USO (United States Oil Fund)
USO is in a short-term uptrend which, based on the degree of accumuation established at the 33/34 level, has farther to go. It may take advantage of an oversold market rally to push higher over the near-term.
Summary
From last week: "Clarification of the market's intention should come next week." There is not too much doubt that the market, although somewhat fragmented, has started a significant correction. Should the interpretation that this is the start of major wave 4 be correct, the decline is just getting underway but, with a clear H&S top formation, a back-test of the neckline is possible.
The hourly indicators are suggesting that the beginning of the back-test could come as early as Monday.
FREE TRIAL SUBSCRIPTON
If precision in market timing for all time framesis something that you find important, you should
Consider taking a trial subscription to my service. It is free, and you will have four weeks to evaluate its worth. It embodies many years of research with the eventual goal of understanding as perfectly as possible how the market functions. I believe that I have achieved this goal.
For a FREE 4-week trial, Send an email to: ajg@cybertrails.com
For further subscription options, payment plans, and for important general information, I encourage
you to visit my website at www.marketurningpoints.com. It contains summaries of my background, my
investment and trading strategies, and my unique method of intra-day communication with
subscribers. I have also started an archive of former newsletters so that you can not only evaluate past performance, but also be aware of the increasing accuracy of forecasts.
Disclaimer - The above comments about the financial markets are based purely on what I consider to be sound technical analysis principles uncompromised by fundamental considerations. They represent my own opinion and are not meant to be construed as trading or investment advice, but are offered as an analytical point of view which might be of interest to those who follow stock market cycles and technical analysis.
Andre Gratian Archive |
© 2005-2022 http://www.MarketOracle.co.uk - The Market Oracle is a FREE Daily Financial Markets Analysis & Forecasting online publication.