


Gold Bugs Will Love This Gold Price Chart
Commodities / Gold and Silver 2013 Aug 20, 2013 - 12:25 PM GMTBy: Money_Morning

 David Zeiler writes: There's no shortage of catalysts pushing gold prices higher, but now gold bugs have another...
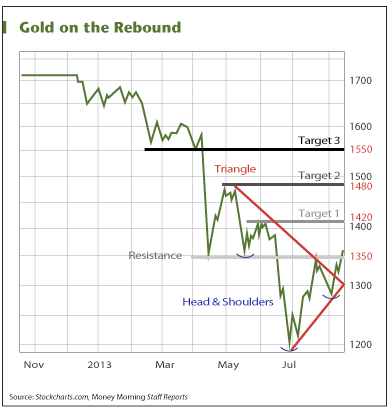
A technical analysis of the chart depicting gold's rocky ride over the past nine months shows that gold prices have only just begun to break out to the upside.
Take a look...
Share on facebook Share on twitter Share on email Share on print More Sharing Services 0
"I like everything about this chart, and I like everything in the macro technical backdrop," Richard Ross, the Global Technical Strategist for Auerbach Grayson, told CNBC last week.
Ross noted that both the triangle and head-and-shoulders patterns in the gold price chart point to a strong bounce.
"If we can take out $1,350, which I think we do, we trade at $1,476," Ross said.
Helped by a jittery stock market, the price of gold got the push it needed Thursday when it shot up 2.06% to $1,360.90.
"The $1,350 level acted as support in mid-April and again in mid-May," said Money Morning Resource Specialist Peter Krauth. "If we can rise above that level and stay there, $1,350 is likely to become support once again."
Editor's Note: To understand what's moving gold prices -- and how to make money from those moves -- here's another gold chart that you absolutely need to see right now...
It was only at the end of June that gold prices dipped below $1,200. Despite the pessimism back then, gold has climbed 13.5% in the weeks since.
Now investors can use the stair-step down right side of this gold price chart as a guide to where the yellow metal is going next.
Here's Krauth's take.
"After $1,350, the next intermediate target is around $1,420," Krauth said. "Beyond that level, I agree that around $1,480 is the following target. But the biggest prize will be $1,550, which also acted as support from mid-February all the way to mid-April."
Abigail Doolittle of the Seaport Group also told CNBC last week that the message of this gold prices chart is unequivocally positive for the yellow metal.
"Gold is going higher from here," said Doolittle. "I have a target of $1,488... Above $1,359 you're just going to see gold rocket higher in my view."
Gold Prices Have Plenty of Catalysts Now
The stellar technical indicators come at a time when lots of other forces are coming together to keep gold prices rising.
One reason is that gold demand continues to outstrip gold supply. This trend isn't going to change any time soon, if ever, as the remaining gold in the ground gets more difficult - and expensive - to extract.
Both China and India, which lead the world in gold buying, have shown no signs of letting up - and in fact have been ramping up their buying this year.
What's more, according to the World Gold Council, consumer buying of physical gold in the second quarter increased by 53% from the same period last year.
"The rally that we are seeing is being supported by the buoyant physical demand," Sterling Smith, a Chicago-based commodity futures specialist at Citigroup Inc., told Bloomberg News. "The mood is definitely bullish."
And despite talk of the Federal Reserve tapering its quantitative easing program, central banks all over the world are still printing money like crazy - an inflationary habit that is always positive for gold prices.
"I also think that some of those long-term gold bugs are starting to get re-excited about the hyperinflation fear," said Doolittle. "We don't need to see inflation for gold to go higher; we just need to have that fear that at some point the Fed may have to print more money to support the economy."
So can gold prices keep going higher from here? And more importantly, can gold prices get back to the record $1,900 range?
Not right away, but eventually gold prices will hit new highs. For the near term, Krauth said that gold prices in 2013 should "certainly make it to $1,480, and maybe even $1,550."
Editor's note: You need to see this to believe what's happening to gold in China...
Source :http://moneymorning.com/2013/08/19/gold-bugs-will-love-what-this-chart-says-about-gold-prices/
Money Morning/The Money Map Report
©2013 Monument Street Publishing. All Rights Reserved. Protected by copyright laws of the United States and international treaties. Any reproduction, copying, or redistribution (electronic or otherwise, including on the world wide web), of content from this website, in whole or in part, is strictly prohibited without the express written permission of Monument Street Publishing. 105 West Monument Street, Baltimore MD 21201, Email: customerservice@moneymorning.com
Disclaimer: Nothing published by Money Morning should be considered personalized investment advice. Although our employees may answer your general customer service questions, they are not licensed under securities laws to address your particular investment situation. No communication by our employees to you should be deemed as personalized investent advice. We expressly forbid our writers from having a financial interest in any security recommended to our readers. All of our employees and agents must wait 24 hours after on-line publication, or after the mailing of printed-only publication prior to following an initial recommendation. Any investments recommended by Money Morning should be made only after consulting with your investment advisor and only after reviewing the prospectus or financial statements of the company.
Money Morning Archive |
© 2005-2022 http://www.MarketOracle.co.uk - The Market Oracle is a FREE Daily Financial Markets Analysis & Forecasting online publication.