


Stock Market Three Peaks and a Domed House; the Tri-Day Method
Stock-Markets / Stock Markets 2013 Aug 20, 2013 - 05:38 PM GMTBy: Ed_Carlson

 The work of George Lindsay is predominately concerned with timing turns in the market but he did have at least one method of forecasting price. Specifically, forecasting bear market lows following 3PDh formations. He called this approach the Tri-Day Method and explained it in a series of five supplements to his newsletter from May to September 1959.
This method forecast a low to the 1917 bear market of 65.85. The actual low on 12/19/17 was 65.95.
It forecast a low in the post-1929 bear market of 41.75. The actual low on 7/8/32 was 41.22.
It forecast a low to the correction in 1953 of 256.32. The actual low on 9/14/53 was 255.49.
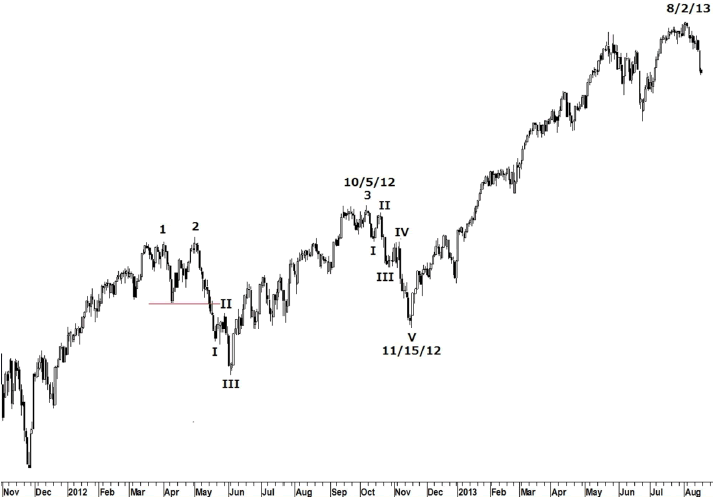
While it would not make a material difference in forecasting the low of our new bear market, the realization that the 2012-2013 3PDh formation is a hybrid Lindsay called Model 3 explains why I didn't recognize the pattern earlier. In Model 3 the reaction following peak 3 becomes the First Floor Roof of the pattern. The reaction following peak 3 on 10/5/12 clearly breaks down into five waves - the most important requirement of a First Floor Roof. A First Floor Roof taking the place of the Separating Decline (reaction following peak 3) is a defining characteristic of Model 3.
Let's examine a check list for recognizing Model 3:
-
The decline following peak 2 is composed of three waves - check!
-
The low of the reaction following peak 2 is lower than the reaction following peak 1 - check!
-
Peak 3 is the highest point of the three peaks - check!
-
The reaction following peak 3 holds above the reaction following peak 2 - check!
Once the model is identified we can use the Tri-Day Method to develop a forecast for the low of the bear market.
The distance from the closing high of peak 3 on 10/5/12 to the low on 11/15/12 is 1,068 Dow points.
The distance from the low on 11/15/12 to the high of the Domed House on 8/2/13 is 3,116 Dow points.
The swingover ratio is 3,116/1,068 and equals 2.90. While the ratio is typically limited to 2.0 (regardless of its determined value), when the distance between the highest peak and the high of the Domed House is 10 months or greater (as it is now) the ratio is capped at 2.2.
The expected loss in the Dow is calculated as follows.
3,116 x 2.2 =6,855
6,855 - 1,068 =5,787
5,787 Dow points is the expected minimum loss for the Dow Industrials index.
8/13/13 The leading authority in Lindsay market analysis.
Subtracting 5,787 from the high, 15,658, provides a forecast for the Dow of 9,871.
3PDh and the Tri-Day Method are explained, in detail, in the book George Lindsay and the Art of Technical Analysis -FT Press, 2011.
Request your free copy of the August Lindsay Report at http://seattletechnicaladvisors.com/contactus.html
Ed Carlson, author of George Lindsay and the Art of Technical Analysis, and his new book, George Lindsay's An Aid to Timing is an independent trader, consultant, and Chartered Market Technician (CMT) based in Seattle. Carlson manages the website Seattle Technical Advisors.com, where he publishes daily and weekly commentary. He spent twenty years as a stockbroker and holds an M.B.A. from Wichita State University.
© 2013 Copyright Ed Carlson - All Rights Reserved
Disclaimer: The above is a matter of opinion provided for general information purposes only and is not intended as investment advice. Information and analysis above are derived from sources and utilising methods believed to be reliable, but we cannot accept responsibility for any losses you may incur as a result of this analysis. Individuals should consult with their personal financial advisors.
© 2005-2022 http://www.MarketOracle.co.uk - The Market Oracle is a FREE Daily Financial Markets Analysis & Forecasting online publication.