


The Coming Stock Market Crash
Stock-Markets / Financial Crash Aug 25, 2013 - 07:22 PM GMTBy: Sam_Chee_Kong

 One mistake most investors made when building their portfolio is using the bottom-up approach where they tend to concentrate on stock picking without paying attention to the overall market. When you apply the bottom-up approach you tend to ‘not see the forest for the trees’ because you are focusing on the ‘micro side’ of the market. Or put it another way, you concentrate on the companies but miss out on the overall market.
The right approach is to apply another strategy known as top-down investing. This approach focuses on the ‘macro side’ of the market. To build a top down portfolio you must first look into the macro economy. By this I mean you should have some idea not only where the stock market is heading but also its valuation. Anyway, to cut the long story short on how the top-down approach works, I present you the following chart.
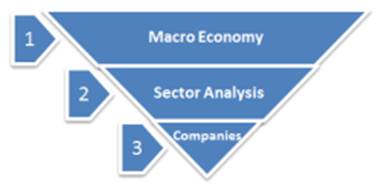
As from the above, before we proceed to stock pick our portfolio we need to do some analysis on the macro side of our market to determine its valuation. But how do we do it?
Market Cap to GDP Valuation Metric
Fortunately, there is a one valuation metric that can be used to gauge the valuation of our stock market. It is called the Market Capitalization to GDP (%). This metric is derived by multiplying the share price of all companies with their shares outstanding and then divide by the GDP. The result is a percentage which measures the total value of the stock market as compared to the output of the economy.
The equilibrium being the 100% level and if the metric is above the equilibrium then it is considered overvalued or trading at a premium and vice versa.
What is the Benchmark?
When asked about the Market Capitalization to GDP valuation method in his article appeared in Forbes in 2011. This is what Warren Buffet has to say.
“It is “probably the best single measure of where valuations stand at any given moment. If the percentage relationship falls to the 70% or 80% area, buying stocks is likely to work very well for you. If the ratio approaches 200%-you are playing with fire.
The following is the chart of the Market Capitalization of all listed companies to GDP (in %) in Malaysia as from 2002 to 2011.
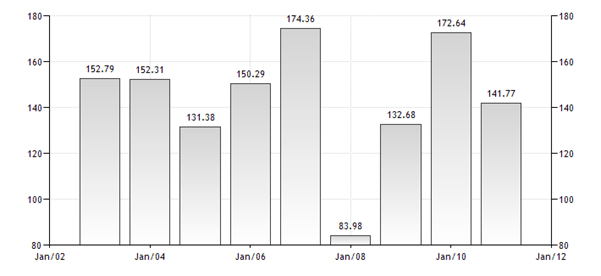
In 2012 our Market Capitalization to GDP was 156% and this meant that our Stock Market trading at a 56% premium over the GDP. The meant our market is overvalued. Another thing to notice is that the best time to buy stocks in KLSE is during 2008 where the valuation is only 84%. The next thing we want to know is how expensive is our market as compared to others?
How expensive is our Stock Market?
To gauge how expensive our Stock Market as compared to others we need to look into the benchmark on Market valuations of other countries. The following table is compiled from data available from World Bank, which is the Market Capitalization to GDP (%) for selected countries from around the world for 2012.
Evidently, our KLSE is the 4th most expensive Market in the world and is trading at 56% premium over its GDP. Other Asian Stock Markets that are trading at a premium over their respective GDP are Thailand (5%), South Korea (5%), Philippines (5%), Singapore (50%) and Hong Kong (320%).
Also notice that Stock Markets from countries that are affected by the current ongoing Financial Crisis are trading at a discount to the GDP. Take for example the PIIGS with Portugal (-69%), Italy (-76%), Ireland (-48%), Greece (-82%) and Spain (-26%) and even Iceland is trading at a big discount (-79%). Their relatively cheap valuation has to do with their market selloff in the past couple of years.
How deep will our Market Plunge?
Honestly, it is definitely not going to be mild because the current carnage is just the beginning. As some of you can recalled in my article dated on 17/08/2013, titled ‘Asian Stock Markets Review and Opportunities’. I mentioned on our market’s correction when the trend line (in black) is broken and volatility will surge and losses will be big. I again present below the daily chart of our FBMKLCI.
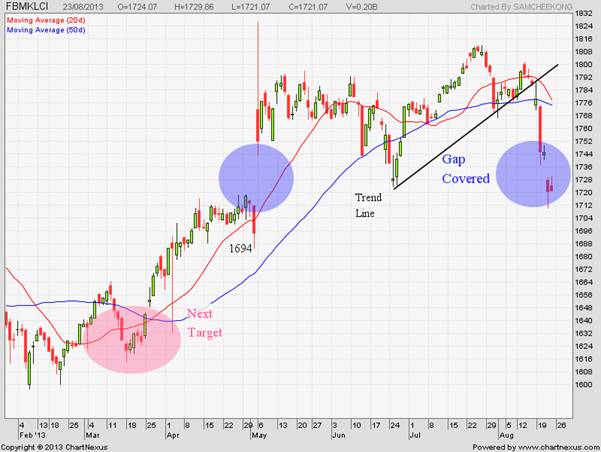
There are a few things that I would like to point out. It already fulfilled the conditions that I put forward previously and they are.
- Broke the Trend line on the 19/08/2013
- Cover the 5 months Gap on 23/08/2013
Moving forward are we going to see further turbulence? The answer is YES and it’s not only in Malaysia but the whole region. Our FBMKLCI will see further downside due to the following.
- Increased outflow of foreign funds from this region.
- Further Currency depreciation in the coming weeks. The main threat coming from India and Indonesia.
- Threat of increase yield in bonds that will affect our interest rates. 10 year bond yields are soaring across the region in the past weeks and if not contained will provide bigger threat to the real economy.
- No firm policy guidance from Central Banks in the region including Malaysia. They are trying to do everything at once meaning accomplishing several policies targeting with limited policy tools. At one moment they are Quantitatively Easing and the next they are doing Monetary Tightening. They are intervening in the foreign exchange market by selling dollars to prop up their own currency. Even our Bank Negara sold several billion of USD to prop up our Ringgit this week. In short there is no ‘Policy Coordination’. As a result this mess is causing jittery among foreign investors.
- We are going into the second stage of the Crisis and this is where volatility in financial markets is heightened. Events can take a turn for the worse in a short period of time. This can be seen from the Asian Financial Crisis in 1998 where the contagion effect spread within weeks. Also in Argentina during their hyperinflationary experience in the 1980s and early 1990s. Their monthly inflation rate can drop from 110% to 20% in a matter of days after government intervention and stabilized before it resumed its next surge to 230% the following month.
Hence as for the midterm (about 2 months), I reckon there is a good chance that our market is heading towards the 1620 points level which was set on 18/03/2013. It is marked with the pink circle. Before that we have to contemplate the first support which is at the 1694 level which is indicated by the blue circle. However this support will not hold and will be easily overcome as there is no solid base building.
Rounding up
In rounding up, I reckon that we have being taken for a ride by the dis-information of facts parroted by our mainstream media. Bank Negara through its ‘reassurance babble’ assured us that everything is fine and within fair valuation, deficits don’t matter, inflation is within expectations, real estate is not in bubble, our debts are manageable and so on. But now the chicken is coming home to roost and we will have to take the brunt of this coming downturn.
Since we know that anything goes up must come down and as the saying goes, ‘The Higher it goes, The Bigger the Crash’. Hence the most important thing to do is to be prepared and get ourselves educated for any eventuality. Anyway any Market Crash is not the end of the world but a form of ‘Wealth Transfer’. But transfer to whom? Well, from the ignorant to the informed because those informed are going to capitalize on this Crash and will emerge much wealthier than before.
So folks get prepared and educated and happy trading.
by Sam Chee Kong
cheekongsam@yahoo.com
© 2013 Copyright Sam Chee Kong - All Rights Reserved
Disclaimer: The above is a matter of opinion provided for general information purposes only and is not intended as investment advice. Information and analysis above are derived from sources and utilising methods believed to be reliable, but we cannot accept responsibility for any losses you may incur as a result of this analysis. Individuals should consult with their personal financial advisors.
© 2005-2022 http://www.MarketOracle.co.uk - The Market Oracle is a FREE Daily Financial Markets Analysis & Forecasting online publication.