


USDCHF Elliott Wave Forecast - Could Test 1.0000 By 2013 End
Currencies / Forex Trading Sep 04, 2013 - 04:42 PM GMTBy: Gregor_Horvat

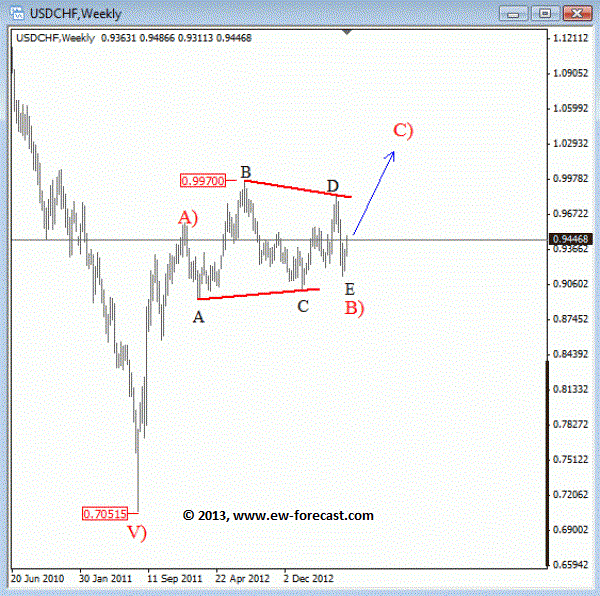
 USDCHF: Sharp reversal in 2011 from 0.7000 area is impulsive leg, and we know that impulses show direction of a current trend. As such, we think that pair is now bullish for minimum three wave rise; A)-B)-C). In the last few months we have seen a slow and choppy price action in 0.8900-1.0000 range which now seems to be a contracting triangle placed in wave B). We can already count five waves within this pattern so traders must be aware for a push higher into wave C) later this year.
USDCHF Weekly Elliott Wave Analysis
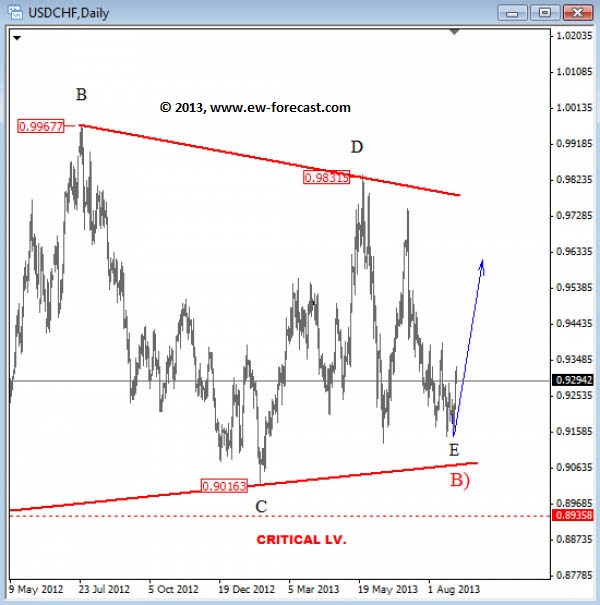
On Daily Chart contracting triangle is now in final stages. We are tracking a wave E that may be looking for a support around 0.9050-0.9200 zone. An impulsive bullish reversal in price back to 0.9700 will put USD in bullish mode against Swiss franc for a push above parity.
USDCHF Daily Elliott Wave Anaysis
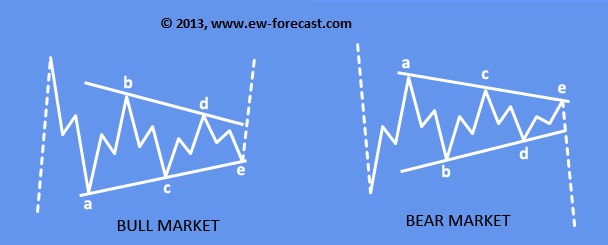
What is Triangle Elliott Wave Pattern?
A Triangle is a common 5 wave pattern which is labeled A-B-C-D-E. Triangle moves counter-trend. It is corrective in nature. Triangles move within two channel lines drawn from waves A to C, and from waves B to D. A Triangle is either contracting or expanding depending on whether the channel lines are converging or expanding. Triangles are overlapping five wave affairs that subdivide 3-3-3-3-3.
Contracting Traingle:
- Structure is 3-3-3-3-3
- Each subwave of a triangle is usually a zig-zag
- Wave E must end in the price territory of wave A
- One subwave of a triangle usually has a much more complex structure than others subwaves
- Aappears in wave four in an impulse, wave B in an A-B-C, wave X or wave Y in a double threes, wave X or wave Z in a triple threes
Written by www.ew-forecast.com | Try our 7 Days Free Trial Here
Ew-forecast.com is providing advanced technical analysis for the financial markets (Forex, Gold, Oil & S&P) with method called Elliott Wave Principle. We help traders who are interested in Elliott Wave theory to understand it correctly. We are doing our best to explain our view and bias as simple as possible with educational goal, because knowledge itself is power.
Gregor is based in Slovenia and has been in Forex market since 2003. His approach to the markets is mainly technical. He uses a lot of different methods when analyzing the markets; from candlestick patterns, MA, technical indicators etc. His specialty however is Elliott Wave Theory which could be very helpful to traders.
He was working for Capital Forex Group and TheLFB.com. His featured articles have been published in: Thestreet.com, Action forex, Forex TV, Istockanalyst, ForexFactory, Fxtraders.eu. He mostly focuses on currencies, gold, oil, and some major US indices.
© 2013 Copyright Gregor Horvat - All Rights Reserved
Disclaimer: The above is a matter of opinion provided for general information purposes only and is not intended as investment advice. Information and analysis above are derived from sources and utilising methods believed to be reliable, but we cannot accept responsibility for any losses you may incur as a result of this analysis. Individuals should consult with their personal financial advisors.
© 2005-2022 http://www.MarketOracle.co.uk - The Market Oracle is a FREE Daily Financial Markets Analysis & Forecasting online publication.