


Stock Market Downtrend Continues
Stock-Markets / Stock Markets 2013 Sep 07, 2013 - 06:42 PM GMTBy: Tony_Caldaro

 For a four day trading week this one certainly had some volatility. After ending last week only five points from the downtrend low the market gapped up on Tuesday hitting SPX 1651. Then it dropped to SPX 1633, rallied to 1662, dropped to 1641, then rallied to 1665. For the week the SPX/DOW were +1.10%, the NDX/NAZ were +1.95% and the DJ World index closed +2.1%. Economic reports again had a positive bias. On the uptick: ISM manufacturing/services, construction spending, monthly payrolls, the monetary base, and both the unemployment rate plus weekly jobless claims improved. On the downtick: the ADP index, factory orders, the WLEI and the trade deficit worsened. Next week we get consumer credit, retail sales and consumer sentiment.
LONG TERM: bull market
Despite the market’s roller coaster ride over the past few weeks the long/medium term count remains unchanged. The stock market is still advancing in a Cycle wave [1] bull market from the Super cycle wave 2 low in March 2009. This bull market appears to have gone through the normal investor sentiment cycle as well. Two years off the lows, most did not believe this was a bull market. Three years off the lows, a shift from disbelief to neutral occurred. Four years off the lows, when the DOW made all time new highs, most accepted it was a bull market after all. Now, many are not expecting another bear market for years to come. It appears we went through the same exact investor sentiment cycle during the last bull market.
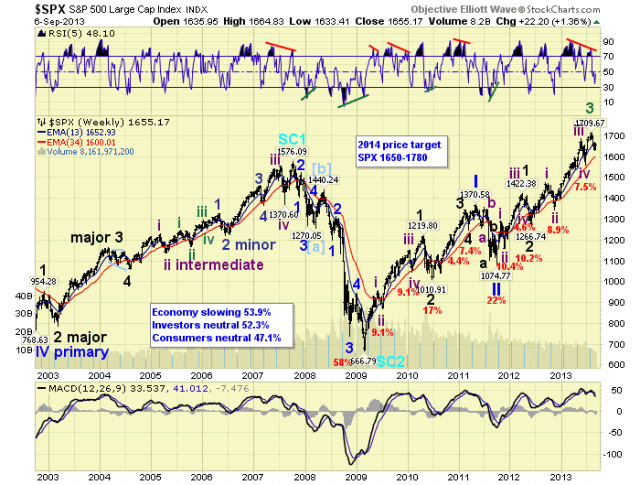
Cycle wave [1] bull markets unfold in five Primary waves. Primary waves I and II completed in 2011, and Primary wave III has been underway since then. Primary I divided into five Major waves with a subdividing Major wave 1. Primary wave III is following a similar pattern, but both Major waves 1 and 3 have subdivided. Major waves 1 and 2 ended by mid-2012, and Major wave 3 ended in August 2013. Major wave 4, of Primary wave III, is currently underway. When this correction concludes, some time this month, a Major wave 5 uptrend should take the market to new highs to end Primary III. Then after a Primary IV correction, a Primary V uptrend should take the market to higher highs completing the bull market. We expect the top to occur by late-winter to early-spring 2014.
MEDIUM TERM: downtrend
For the most part the SPX and DOW have remained in lock step throughout this bull market. There was one exception however: the spring of 2012. Then the DOW confirmed a downtrend, while the SPX did not. The DOW then rallied to new highs, while the SPX did not. After this they both corrected in unison about 10%. The NDX/NAZ, however, have been in a bull market pattern all their own.
We are not suggesting the DOW will make new highs before the entire market corrects further. We are only noting that the four major indices can diverge for a short period of time, which generally produces no net real progress. Then when they re-sync the main trend is usually sharp and swift. Currently we have the bellwether DOW in a confirmed downtrend. While the SPX/NDX/NAX appear to be trading between bull market highs and their recent lows. In the end, before much upside progress is made, the DOW’s downtrend will exert itself and take the market lower.
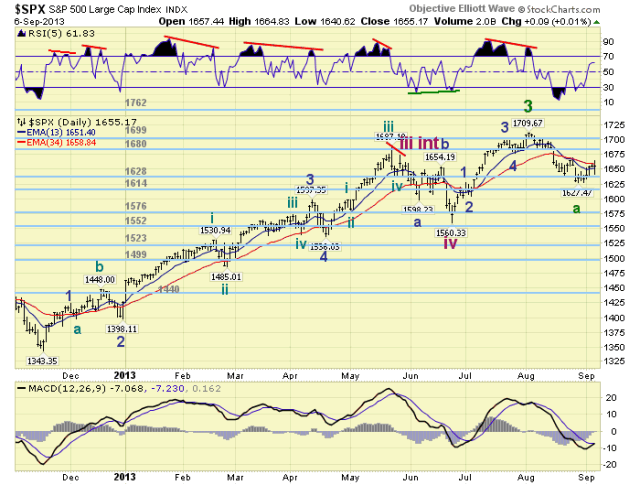
When this downtrend began we guesstimated a three Intermediate wave decline in the SPX: 1630-1670-1540. The SPX dropped to 1639, and then rallied to 1670 before heading to 1627. Naturally we assumed SPX 1639 ended the first wave down, 1670 ended the counter-trend rally, and the drop to 1540 was next. When the market reached SPX 1627 it bounced around before rallying this week to 1665. This last rally was quite clearly the best rally, since the downtrend began, in both the SPX and DOW. Therefore SPX 1627 looks like the Intermediate wave A low and we have rallied in Int. wave B. When this rally concludes, Intermediate wave C should be next. Medium term support is at the 1628 and 1614 pivots, with resistance at the 1680 and 1699 pivots.
SHORT TERM
This tricky initial decline for Major wave 4 has unfolded in five Minor waves SPX: 1685-1700-1639-1670-1627. We have labeled this Intermediate wave A. Intermediate wave B, however, has been extremely choppy. With the rallies and pullbacks getting larger and larger as the rallied has unfolded. As it has unfolded the wave pattern has fit into a rising wedge, or ending diagonal. The DOW, btw, ended its uptrend with an ending diagonal. The Int. wave B wave pattern can also be counted as a double three: [1646-1628-1651]-1633-[1662-1641-1665]. However one looks at this rally it does not look impulsive at all. So where does it end.
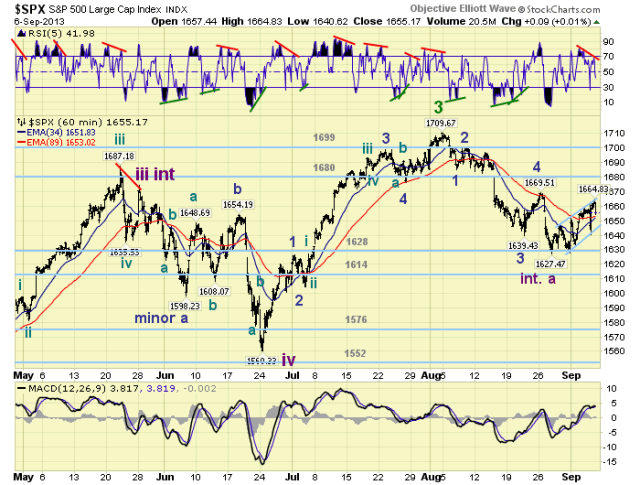
Short term resistance is at SPX 1658-1667 and the 1680 pivot range. The rally hit the lower range on Friday. Fifty percent and 61.8% Fibonacci retracements of Int. wave A suggest SPX: 1669 and 1678. Again just about the same ranges. The Minor fourth wave of Int. wave A was at SPX 1670. So all indications are that Intermediate wave B should be topping out soon. Also of note, Friday ended the day with a short term negative divergence. This is the first negative divergence since the uptrend high at SPX 1710. So Friday’s high at SPX 1665 can not be ruled out as the high either. Overall, it would appear there is little upside ahead before Int. wave C asserts itself and the market heads lower.
FOREIGN MARKETS
The Asian markets were mostly higher gaining 2.1% on the week. India, Indonesia, Japan and Singapore remain in downtrends.
The European markets were all higher gaining 3.0%. No confirmed downtrends here yet.
The Commodity equity group were all higher gaining 4.4%. Russia is still in a confirmed downtrend.
The DJ World index is still uptrending and gained 2.1% on the week. Thirty percent of the world’s markets are in confirmed downtrends.
COMMODITIES
Bonds continue to downtrend losing 1.0% on the week. 10YR yields have now risen from a record 1.39% low in July 2012 to 2.98%.
Crude remains in a volatile uptrend gaining 2.4% on the week.
Gold is still uptrending but lost 0.4% on the week.
The USD is now uptrending gaining 0.1% on the week. The downtrending EURUSD lost 0.3%, and the JPYUSD lost 0.9%.
Next week
Monday: Consumer credit at 3:00. Wednesday: Wholesale inventories. Thursday: weekly Jobless claims, Export/Import prices, and the Budget deficit. Friday: Retail sales, the PPI, Consumer sentiment and Business inventories. The FED remains unusually quiet with no public scheduled meetings/speeches until the FOMC on the 17th and 18th. QE tapering starting in October? Best to your weekend and week!
CHARTS: http://stockcharts.com/public/1269446/tenpp
http://caldaroew.spaces.live.com
After about 40 years of investing in the markets one learns that the markets are constantly changing, not only in price, but in what drives the markets. In the 1960s, the Nifty Fifty were the leaders of the stock market. In the 1970s, stock selection using Technical Analysis was important, as the market stayed with a trading range for the entire decade. In the 1980s, the market finally broke out of it doldrums, as the DOW broke through 1100 in 1982, and launched the greatest bull market on record.
Sharing is an important aspect of a life. Over 100 people have joined our group, from all walks of life, covering twenty three countries across the globe. It's been the most fun I have ever had in the market. Sharing uncommon knowledge, with investors. In hope of aiding them in finding their financial independence.
Copyright © 2013 Tony Caldaro - All Rights Reserved Disclaimer: The above is a matter of opinion provided for general information purposes only and is not intended as investment advice. Information and analysis above are derived from sources and utilising methods believed to be reliable, but we cannot accept responsibility for any losses you may incur as a result of this analysis. Individuals should consult with their personal financial advisors.
Tony Caldaro Archive |
© 2005-2022 http://www.MarketOracle.co.uk - The Market Oracle is a FREE Daily Financial Markets Analysis & Forecasting online publication.