Corporate Earnings Growth to Ramp Up? Call Me a Skeptic
Companies / Corporate Earnings Oct 23, 2013 - 11:47 AM GMTBy: John_Mauldin
 In today’s Outside the Box, Sheraz Mian, Director of Research for Zacks Investment Research, gives us an overview of corporate earnings trends for the past several quarters and consensus expectations going forward, and asks, “How realistic are these expectations?”
Not very, he says, and tells us why. This is the sort of thorough, no-nonsense analysis Zacks is famous for. Zacks Investment Research was founded in 1978 by Len Zacks, PhD. Many innovations have come from this firm over the years, including the creation of the Earningps Consensus that many investors use now to compare versus actual earnings reports. Most notably, Len discovered the predictive power of earnings estimate revisions. He harnessed these benefits into the proprietary Zacks Rank stock rating system that has allowed Zacks Rank to compile an outstanding track record.
I am in New York for the next few days doing a media “tour” for my new book, Code Red, which will be out next week. I saw the book for the first time last night and sat down to read it again, skipping here and there, somewhat like a curious father viewing his new offspring. Co-author Jonathan Tepper and I will be speaking and sitting for a video as well. Tom Keene was very complimentary about the book this morning. It will hopefully be in bookstores this weekend.
The headline on Bloomberg as I send this note is “Europe Breakup Forces Mount as Union Relevance Fades.” You can go to the bank that this will mean the ECB will soon be issuing yet another Code Red version of easy money to try and smooth over a crisis. It’s a familiar pattern. And one that in the end will not yield the results they desire.
I hope this book does as well as Endgame. Tomorrow night (Wednesday) is the book launch party at the Hyatt Union Square from 5:30-7. It will be fun to see old friends and celebrate book #6. Come on by if you like.
Your hoping for more kind reviews analyst,
John Mauldin, Editor
Outside the Box
JohnMauldin@2000wave.com Earnings Growth to Ramp Up? Call Me a Skeptic
By Sheraz Mian
Stocks have performed impressively this year and have largely been able to hold on to the gains despite monetary and fiscal uncertainties and the less than inspiring economic and earnings pictures. In a price-earnings framework for the market, most of the gains this year have resulted from investors’ willingness to pay a higher multiple for pretty much the same, or even lower, earnings.
Reasonable people can disagree over the extent of the Fed’s role in the market’s upward push, but few would argue that the Bernanke Fed’s easy-money policy has been a key, if not the only, driver of this trend. If nothing else, the Fed policy of deliberately low interest rates pushed investors into riskier assets, including stocks.
But with the Fed getting ready to institute changes to its policy, investors will need to go back to fundamentals to keep pushing stocks higher.
We don’t know when the Fed will start ‘Tapering’ its bond purchases, but we do know that they want to get out of the QE business in the not-too-distant future. What this means for investors is that they will need to pay a lot more attention to corporate earnings fundamentals than has been the case thus far.
The overall level of corporate earnings remains quite high. In fact, aggregate earnings for the S&P 500 reached an all-time record in 2013 Q2 and are expected to be not far from that level in the ongoing Q3 earnings season as well. There hasn’t been much earnings growth lately, but investors are banking on material growth resumption from Q4 onwards. This hope is reflected in current consensus expectations for 2013 Q4 and full-year 2014.
I remain skeptical of current consensus earnings expectations and would like to share the basis for my skepticism with you. The goal is to convince you that current earnings expectations remain vulnerable to significant downward revisions.
Negative estimate revisions haven't mattered much over the last few quarters as the Fed's generous liquidity supply helped lift all boats. But if the Fed is going to be less of a supporting actor going forward, then it's reasonable to expect investors to start paying more attention to fundamentals. It is in this context that the coming period of negative revisions could potentially result in the market giving back some, if not all, of its recent gains.
This discussion is particularly timely as we are in the midst of the 2013 Q3 earnings season that will help shape consensus estimates for Q4 and beyond. In the following sections, I will give you an update on the Q3 earnings season and critically review consensus expectations for Q4 and beyond.
The Q3 Scorecard
As of Monday, October 21st, we have Q3 results from 109 companies in the S&P 500 that combined account for 31.6% of the index’s total market capitalization. Total earnings for these 109 companies are up +7.5% year over and 63.3% of companies beat earnings expectations with a median surprise of +2.1%. Total revenues are up +2.1%, with 45.9% of the companies beating top-line expectations and median revenue surprising by +0.02%.
The table below presents the current scorecard for Q3
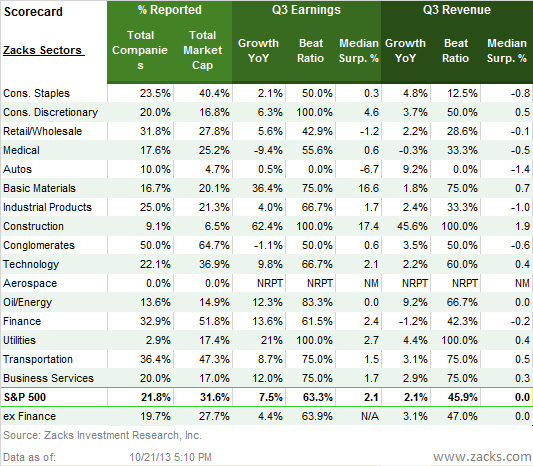
Note: One sector, Aerospace, has not reported any Q3 results yet. NRPT means ‘no reports’; NM means ‘not meaningful’.
With results from more than 30% of the S&P 500’s total market capitalization already out, we are seeing the Q3 earnings picture slowly emerge. This is particularly so for the Finance sector, where 51.8% of the sector’s total market cap has already reported. Other sectors with meaningful sample sizes include Transportation (47.3%), Consumer Staples (40.4%), Technology (36.9%) and Medical (25.2%).
Finance has been a steady growth driver for the last many quarters and is diligently playing that role this time around as well despite anemic loan demand, wind-down of the mortgage refi business and weak capital markets activities, particularly on the fixed income side. Outside of Finance, total earnings are up +4.4% for the companies that have reported already.
How do the 2013 Q3 results thus far compare with the last few quarters?
The short answer is that they are no better than what we have seen from this same group of 109 companies in recent quarters. In fact, on a number of counts the results thus far do not compare favorably to either the preceding quarter (2013 Q2), or the 4-qurater average, or both.
Specifically, the earnings and revenue growth rates and revenue beat ratio are tracking lower, while the earnings beat ratio is about in-line

The charts below compare the beat ratios for these 109 companies with what these same companies reported in Q2 and the 4-quarter average (beat ratio is the % of total companies coming ahead of consensus expectations).

The trends we have seen thus far will shift to some extent as the rest of the reporting season unfolds, but not by much. A composite look at the Q3 earnings season, combining the actual results from the 109 companies with estimates for the 391, is for +2.1% earnings growth on +0.8% higher revenues, as the summary table below shows.
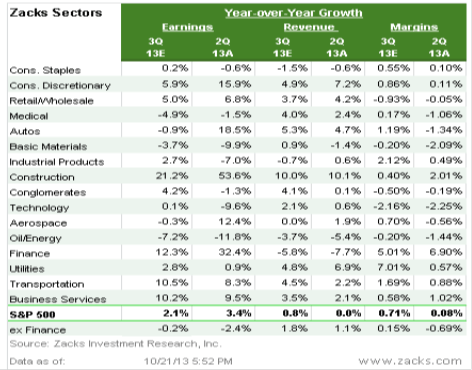
Earnings growth rate has averaged a little over +3% over the first two quarters of the year and will likely stay at or below that level in Q3 as well. With respect to beat ratios, roughly two-thirds of the companies come ahead of expectations in a typical quarter and the Q3 ratio will likely be in that same vicinity.
The ‘Expectations Management’ Game
In the run up to the start of the Q3 earnings season, consensus earnings estimates came down sharply. The primary reason for the estimate cuts – guidance from management teams. Companies guided lower for Q3 while reporting Q2 results, a trend that has remained in place for more than a year now.
The chart below does a good job of showing the evolving Q3 earnings expectations over the last few months.
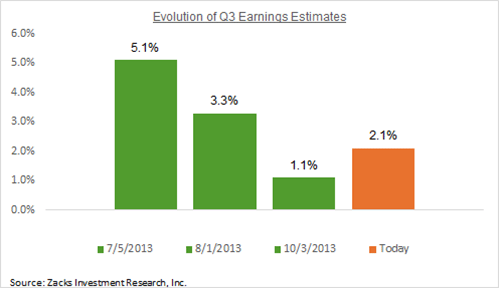
The Q3 estimate cuts weren’t unusual or peculiar to the quarter, as we have been seeing this trend play out repeatedly for more than a year now. The chart below compares the trends in earnings estimate revisions in the run up to the Q3 and Q2 reporting seasons
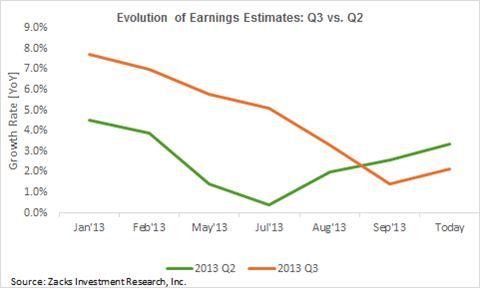
These expectations mean that Q3 wouldn't be materially different from what we have become accustomed to seeing quarter after quarter, with roughly two-thirds of the companies beating consensus earnings estimates. This game of under-promise and over-deliver by management teams has been around long enough that it has likely lost most of its value in investors’ eyes.
Beat ratios may not carry as much informational value this time around, but what will be particularly important is company guidance for Q4 and beyond. Guidance is always very important, but it has assumed added significance this time around given the elevated hopes that Q4 represents a material earnings growth ramp up after essentially flat growth over the last many quarters.
Evaluating Expectations for Q4 & Beyond
Let's take a look at how consensus earnings expectations for 2013 Q3 compare to what companies earned in the last few quarters and what they are expected to earn in the coming quarters.
The chart below shows the expected Q3 total earnings growth rate for the S&P 500 contrasted with the preceding two and following two quarters. (Please note that the Q3 growth rate is for the composite estimate for the S&P 500, combining the 109 that have reported with the 391 still to come)
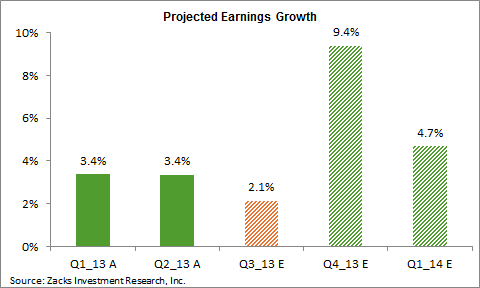
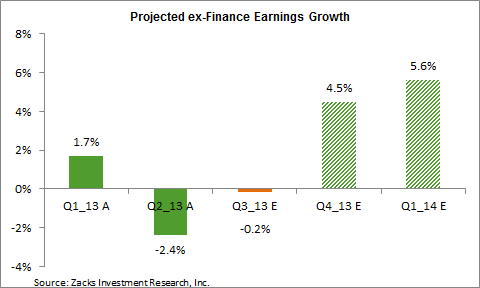
The Finance sector has been a big earnings growth driver for some time. Outside of the Finance sector, total earnings growth for the S&P 500 was in the negative in 2013 Q2 and is expected to be no better in Q3. But the high hopes from Q4 and beyond reflect a strong turnaround in growth outside of Finance.
The chart below shows the same data as the one above, but excludes the Finance sector.
What this means is that quarterly earnings growth was +3.4% in the first two quarters of the year, is expected to be 2.1% in Q3, but accelerate to a +9.4% pace in Q4. And not all of the expected Q4 growth is coming from the Finance sector, as the rest of the corporate world is expected to reverse trend and start contributing nicely from Q4 onwards.
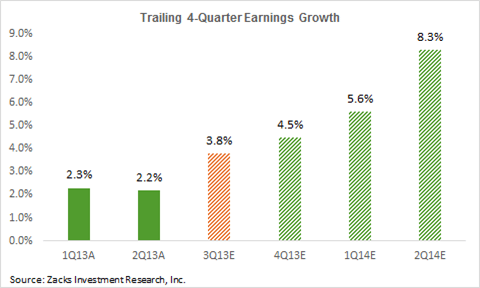
The chart below shows the same data, but this time on a trailing 4-quarter basis. The way to read this chart of steadily rising expectations is that total earnings for the S&P 500 are on track to be up +3.8% year over year in the four quarters through Q3, but accelerate to +4.5% in Q4 and +5.6% in 2014 Q1. Consensus expectations are for total earnings growth of +11.8% in calendar year 2014.
The two charts below show earnings for the S&P 500; not EPS, but total earnings. The first chart shows quarterly totals, while the second one presents the same data on a trailing 4-quarter basis. As you can see, the 'level' of total earnings is very high. In fact, quarterly earnings have never been this high - the 2013 Q2 total of $260.3 billion was an all-time quarterly record.
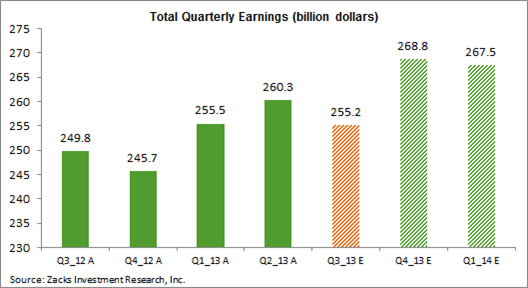
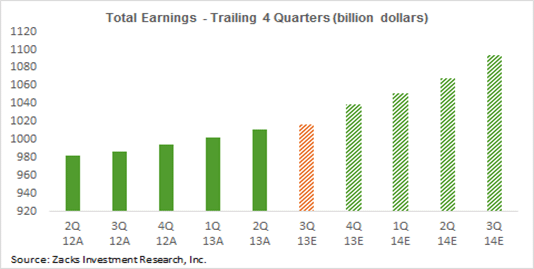
The data in this chart reflects current consensus estimates. This shows that consensus is looking for new all-time record quarterly totals in the coming two quarters. The high expected growth rates in Q4 and beyond are more than just easy comparisons, they represent material gains in total earnings.
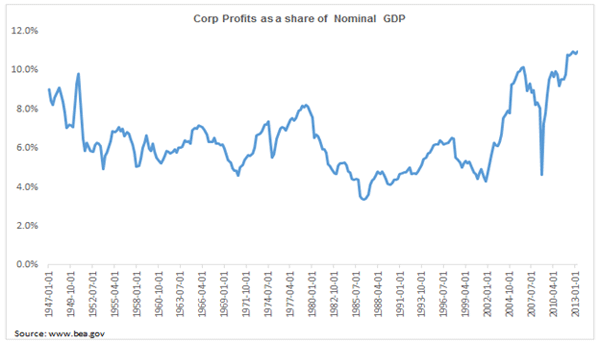
The record level of current corporate profits is also borne by the very high level of corporate profits as a share of nominal GDP, which has never been this high ever. The chart below, using data from the BEA, of corporate profits as a share of nominal GDP clearly shows this.
Where Will the Growth Come From?
There is some truth to the claim that the current record level of corporate profits, whether in absolute dollar terms or as a share of the GDP, does not mean that earnings have to necessarily come down. But earnings don’t grow forever either as current consensus expectations of double-digit growth next year and beyond seem to imply.
After all, earnings in the aggregate can grow only through two avenues - revenue growth and/or margin expansion.
Revenue growth is strongly correlated with 'nominal' GDP growth. If the growth outlook for the global economy is positive or improving, then it’s reasonable to expect corporate revenues to do better as well. But the global economic growth outlook is at best stable, definitely not improving as the recent estimate cuts by the IMF shows.
The U.S. economic outlook has certainly stabilized and GDP growth in Q4 is expected to be modestly better than Q3’s growth pace. The expectation is for growth to materially improve in 2014, with consensus GDP growth estimates north of +3% for 2014 and even higher the following year. Europe isn’t expected to become an engine of global growth any time soon, but the region’s recession has ended and its vitals appear to be stabilizing. The magic of Abenomics is expected to revitalize Japan, but it’s nothing more than a hope at this stage. In the emerging world, sentiment on China has improved, but India, Brazil, Turkey and other former high flyers appear to be struggling.
All in all, this isn’t a picture to get overly excited about. But with almost 60% of the S&P 500 revenues coming from the domestic market, the expected GDP ramp up next year should have a positive effect on corporate revenues, which are expected to increase by +4.2% in 2004. But in order to reach the expected +11.8% total earnings growth in 2014, we need a fair amount of expansion in net margins to compliment the +4.2% revenue growth.
Can Margins Continue to Expand?
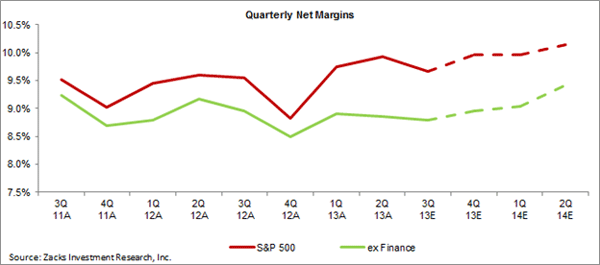
The two charts show net margins (total income/total revenues) for the S&P 500, on a quarterly and trailing 4-quarter basis. For both charts, the data through 2013 Q2 represents actual results, while the same for Q3 and beyond represent net margins implied by current consensus estimates for earnings and revenues.
The chart below shows net margins the same data for a longer time span on a calendar year basis – from 2003 through 2014.
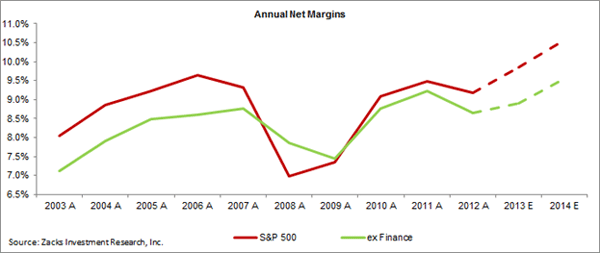
As you can see margins have come a long way from the 2009 bottom and by some measures have already peaked out.
Margins follow a cyclical pattern. As the above chart shows, they expand as the economy comes out of a recession and companies use existing resources in labor and capital to drive business. But eventually capacity constraints kick in, forcing companies to spend more for incremental business. Input costs increase and they have hire more employees to produce more products and services. At that stage, margins start to contract again.
We may not be at the contraction stage yet, but given the current record level of margins and how far removed we are from the last cyclical bottom, we probably don’t have lot of room for expansion. The best-case outcome on the margins front will be for stabilization at current levels; meaning that companies are able to hold the line on expenses and keep margins steady. We will need to buy into fairly optimistic assumptions about productivity improvements for current consensus margin expansion expectations to pan out.
So What Gives?
What all of this boils down to is that current consensus earnings estimates are high and they need to come down - and come down quite a bit. I don't subscribe to the view held by some stock market bears that earnings growth will turn negative. But I don't buy into the perennial growth story either.
So what's the big deal if estimates for Q4 come down in the coming days and weeks? After all, estimates have been coming down consistently for more than a year and the stock market has not only ignored the earnings downtrend, but actually scaled new heights.
A big reason for investors' disregard of negative estimate revisions has been that they always looked forward to a growth ramp up down the road. In their drive to push stocks to all-time highs in the recent past, investors have been hoping for substantial growth to eventually resume. The starting point of this expected growth ramp-up kept getting delayed quarter after quarter. The hope currently is that Q4 will be the starting point of such growth.
Guidance has overwhelmingly been negative over the last few quarters. But if current Q4 expectations have to hold, then we will need to see a change on the guidance front; we need to see more companies either guide higher or reaffirm current consensus expectations. Anything short of that will result in a replay of the by-now familiar negative estimate revisions trend that we have been seeing in recent quarters.
Will investors delay the hoped-for earnings growth recovery again this time or finally realize that the period of double-digit earnings growth is perhaps behind us for good? Hard to tell at this stage, but we will find out soon enough.
My sense is that markets can buck trends in aggregate earnings for some time, as they have been doing lately. But expecting the trend to continue indefinitely may not be realistic.
220 Stocks To Sell Now
No matter where the market is headed, one fact is obvious: You should not buy and hold stocks unless they offer good prospects for profit. I can help you weed out many of the ones that don't make the grade. That is because my company, Zacks Investment Research, is releasing to the public its list of 220 Stocks to Sell Now.
These Strong Sells are sinister portfolio killers because many have good fundamentals and seem like good buys. But something important has happened to each of them that greatly lowers their odds of success. Historically, such stocks perform 6 times worse than the market.
I invite you to examine this list for free and make sure no stock you own or are considering is on it. Today you are welcome to see it and other time-sensitive Zacks information at no charge and with no obligation to purchase anything.
See Zacks’ “220 Stocks to Sell Now” list for Free.
Best,
Sheraz Mian
Sheraz Mian is the Director of Research for Zacks and manages its award-winning Focus List portfolio.John Mauldin
subscribers@MauldinEconomics.com
Outside the Box is a free weekly economic e-letter by best-selling author and renowned financial expert, John Mauldin. You can learn more and get your free subscription by visiting www.JohnMauldin.com.
Please write to johnmauldin@2000wave.com to inform us of any reproductions, including when and where copy will be reproduced. You must keep the letter intact, from introduction to disclaimers. If you would like to quote brief portions only, please reference www.JohnMauldin.com.
John Mauldin, Best-Selling author and recognized financial expert, is also editor of the free Thoughts From the Frontline that goes to over 1 million readers each week. For more information on John or his FREE weekly economic letter go to: http://www.frontlinethoughts.com/
To subscribe to John Mauldin's E-Letter please click here:http://www.frontlinethoughts.com/subscribe.asp
Copyright 2013 John Mauldin. All Rights Reserved
Note: John Mauldin is the President of Millennium Wave Advisors, LLC (MWA), which is an investment advisory firm registered with multiple states. John Mauldin is a registered representative of Millennium Wave Securities, LLC, (MWS), an FINRA registered broker-dealer. MWS is also a Commodity Pool Operator (CPO) and a Commodity Trading Advisor (CTA) registered with the CFTC, as well as an Introducing Broker (IB). Millennium Wave Investments is a dba of MWA LLC and MWS LLC. Millennium Wave Investments cooperates in the consulting on and marketing of private investment offerings with other independent firms such as Altegris Investments; Absolute Return Partners, LLP; Plexus Asset Management; Fynn Capital; and Nicola Wealth Management. Funds recommended by Mauldin may pay a portion of their fees to these independent firms, who will share 1/3 of those fees with MWS and thus with Mauldin. Any views expressed herein are provided for information purposes only and should not be construed in any way as an offer, an endorsement, or inducement to invest with any CTA, fund, or program mentioned here or elsewhere. Before seeking any advisor's services or making an investment in a fund, investors must read and examine thoroughly the respective disclosure document or offering memorandum. Since these firms and Mauldin receive fees from the funds they recommend/market, they only recommend/market products with which they have been able to negotiate fee arrangements.
Opinions expressed in these reports may change without prior notice. John Mauldin and/or the staffs at Millennium Wave Advisors, LLC and InvestorsInsight Publishing, Inc. ("InvestorsInsight") may or may not have investments in any funds cited above.
Disclaimer PAST RESULTS ARE NOT INDICATIVE OF FUTURE RESULTS. THERE IS RISK OF LOSS AS WELL AS THE OPPORTUNITY FOR GAIN WHEN INVESTING IN MANAGED FUNDS. WHEN CONSIDERING ALTERNATIVE INVESTMENTS, INCLUDING HEDGE FUNDS, YOU SHOULD CONSIDER VARIOUS RISKS INCLUDING THE FACT THAT SOME PRODUCTS: OFTEN ENGAGE IN LEVERAGING AND OTHER SPECULATIVE INVESTMENT PRACTICES THAT MAY INCREASE THE RISK OF INVESTMENT LOSS, CAN BE ILLIQUID, ARE NOT REQUIRED TO PROVIDE PERIODIC PRICING OR VALUATION INFORMATION TO INVESTORS, MAY INVOLVE COMPLEX TAX STRUCTURES AND DELAYS IN DISTRIBUTING IMPORTANT TAX INFORMATION, ARE NOT SUBJECT TO THE SAME REGULATORY REQUIREMENTS AS MUTUAL FUNDS, OFTEN CHARGE HIGH FEES, AND IN MANY CASES THE UNDERLYING INVESTMENTS ARE NOT TRANSPARENT AND ARE KNOWN ONLY TO THE INVESTMENT MANAGER.
John Mauldin Archive |
© 2005-2022 http://www.MarketOracle.co.uk - The Market Oracle is a FREE Daily Financial Markets Analysis & Forecasting online publication.


