


Stocks Bull Market Continues
Stock-Markets / Stock Markets 2013 Nov 03, 2013 - 12:20 PM GMTBy: Tony_Caldaro

 The market started the week by making new all time highs everyday until the FED concluded its FOMC meeting. Then after hitting SPX 1775 earlier that morning the market pulled back for the rest of the week. For the week the SPX/DOW were +0.15%, the NDX/NAZ were -0.30%, and the DJ World index was -0.60%. On the economic front positive reports outpaced negative ones 9 to 6. On the uptick: industrial production, capacity utilization, Case-Shiller, business inventories, the CPI, the Chicago PMI, ISM manufacturing, the monetary base and weekly jobless claims improved. On the downtick: pending home sales, retail sales, the PPI, consumer confidence, the ADP and the WLEI. Next week we try again for Q3 GDP (est. +1.9% to 2.4%), monthly Payrolls and PCE prices.
LONG TERM: bull market
After four years of FED Bond buying programs nearly everyone has caught on to what is driving this bullish asset cycle: Quantitative Easing. We have written about this several times before. Recently we checked to see how QE 3 is performing relative to the market performance of QE 1 and QE 2. What we found is significant under performance. QE 1 ran from Mar09 to Jun10, was $1.4tln in total, and the market rose 1% per month per $20bln. QE 2 ran from Aug10 to Jun11, was $600bln in total, and the market again rose 1% per month per $20bln. QE 3 is still underway from Dec12, is $85 bln per month, and the market is rising at 1% per month per $40bln.
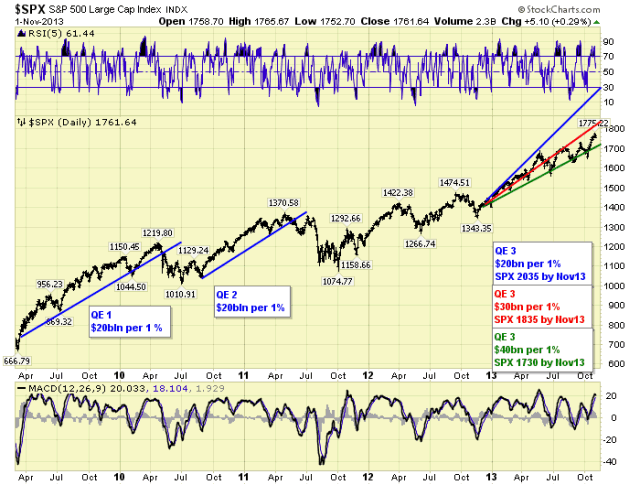
In the chart above we display the projected trends of QE 1 and QE 2, and notice how the market stayed above that trend until a few months before the program ended. With QE 3 we have drawn three projected trends: blue at the normal 1% per $20bln/mth; red at 1% per $30bln/mth; and green at 1% per $40bln/mth. Notice the market is stuggling to remain above the lowest trendline, while rising at half the rate of the previous QE programs. Quantitative Easing is clearly losing its effectiveness at the market’s current lofty levels.
In the meantime the bull market continues to unfold. We have been projecting a Cycle wave [1] bull market lasting until late-winter to early-spring 2014, with an upper price target of the 1779 OEW pivot. It is now early November and the SPX has already reached the 1779 ( 7 point) pivot range, with months to spare. With QE 3 still underway the market is likely to continue higher.
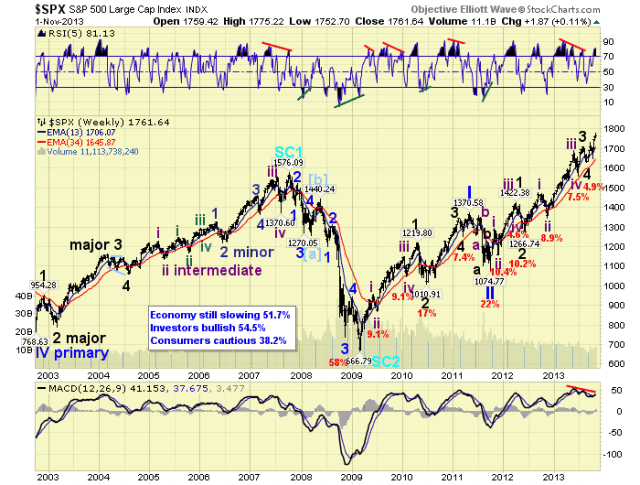
Cycle wave [1] is unfolding in five Primary waves. Primary waves I and II completed in 2011, and Primary III has been underway since then. Primary I divided into five Major waves with a subdividing first wave. Primary III has also divided into five Major waves, but both the first and third waves subdivided. Currently we are in Major 5 of Primary III. When it concludes we should get the largest correction of the year for Primary IV. Then we are expecting a simple, one trend, Primary V to end the bull market.
MEDIUM TERM: uptrend
All the major US indices we track are in confirmed uptrends. We have been counting the SPX uptrend from late August at 1627. The DOW, unfortunately in this trifurcation market, has only been uptrending since early October. Nevertheless, the SPX count we have been posting displays an Int. wave i/a at 1730, an Int. wave ii/b at 1646, and an Int. iii/c reaching 1775 this week. The reason for the number/letter wave label, is that we are not quite sure if a normal five wave advance will occur during this Major wave 5 uptrend. Or an ending diagonal triangle. When Int. wave iv/d concludes we will have our answer.
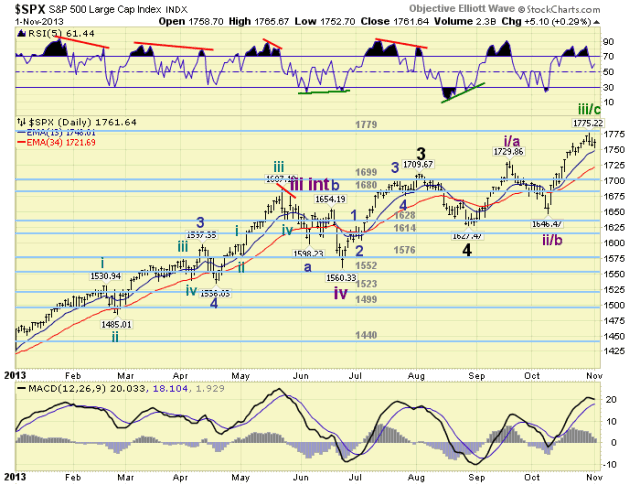
The current Int. wave iii/c advance may have concluded at SPX 1775. We can count five Minor waves up from the SPX 1646 low. And, the market has become quite choppy for the first time since this advance began. We would expect a drop to at least the mid-1740′s to help confirm Int. wave iv/d has been underway. Technically, besides the recent choppy action, the market has recently had its largest pullback since the advance began. This often indicates a larger pullback is underway. Medium term support is at the 1699 and 1680 pivots, with resistance at the 1779 pivot.
SHORT TERM
The Int. wave iii/c advance from SPX 1646 has unfolded in five Minor waves: 1712-1696-1759-1741-1775. The fifth wave, only 34 points, was the shortest. After that high the market has declined in an abc to SPX 1756, rallied to 1769, then declined in another abc to 1753 on friday. At the second low there was a clear short term positive divergence, and the market rallied into the close. This decline could be labeled Minor a of Int. wave iv/d, friday’s rally Minor b, with Minor c to follow next week. This appears to be the most probable count. There appears to be good resistance between SPX 1766 and 1769, with good support around SPX 1740. If the market drops into the SPX low 1740′s and then begins to impulse again the i-ii-iii-iv-v count is in play. If it drops below SPX 1730 then the a-b-c-d-e count is in play.
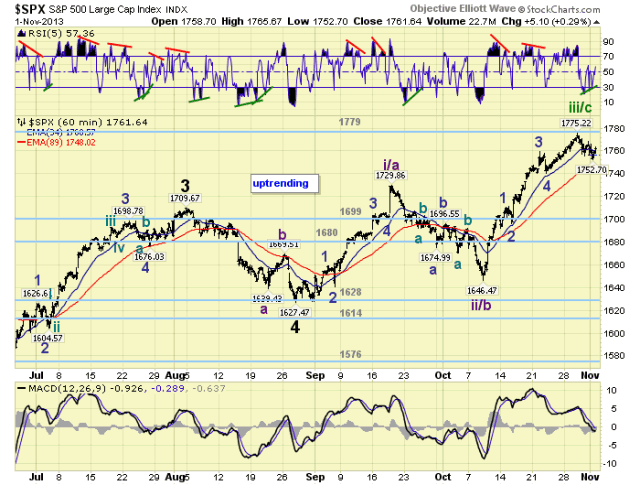
Short term support is at SPX 1753 and SPX 1730, with resistance at the 1779 pivot range and SPX 1804. Short term momentum is rising off a positive divergence. The short term OEW charts have flip-flopped for two days now, ended positive, with the reversal level at SPX 1760. Best to your trading next week.
FOREIGN MARKETS
The Asian markets were mostly higher on the week gaining 0.5%. China, Hong Kong, Indonesia, Japan and Singapore are all in confirmed downtrends.
The European markets were mostly higher but only gained 0.2%.
The Commodity equity group were all lower losing 0.7%.
The DJ World index remains in an uptrend but lost 0.6%.
COMMODITIES
Bonds continue to uptrend but lost 0.5% on the week.
Crude continues to downtrend losing 3.4% on the week.
Gold is trying to uptrend but lost 2.8% on the week.
The USD is uptrending again gaining 1.9% on the week.
NEXT WEEK
Monday: Factory orders at 10AM. Tuesday: ISM services at 10AM. Wednesday: Leading indicators at 10AM. Thursday: Q3 GDP, weekly Jobless claims and Consumer credit. Friday: the monthly Payrolls report, Personal income/spending, PCE prices and Consumer sentiment. Three speeches on tap for the FED next week: Monday: FED governor Powell at 11:30; Thursday: FED governor Stein at 2PM; and Friday: FED chairman Bernanke at 3:30PM. Best to your weekend and week!
CHARTS: http://stockcharts.com/public/1269446/tenpp
http://caldaroew.spaces.live.com
After about 40 years of investing in the markets one learns that the markets are constantly changing, not only in price, but in what drives the markets. In the 1960s, the Nifty Fifty were the leaders of the stock market. In the 1970s, stock selection using Technical Analysis was important, as the market stayed with a trading range for the entire decade. In the 1980s, the market finally broke out of it doldrums, as the DOW broke through 1100 in 1982, and launched the greatest bull market on record.
Sharing is an important aspect of a life. Over 100 people have joined our group, from all walks of life, covering twenty three countries across the globe. It's been the most fun I have ever had in the market. Sharing uncommon knowledge, with investors. In hope of aiding them in finding their financial independence.
Copyright © 2013 Tony Caldaro - All Rights Reserved Disclaimer: The above is a matter of opinion provided for general information purposes only and is not intended as investment advice. Information and analysis above are derived from sources and utilising methods believed to be reliable, but we cannot accept responsibility for any losses you may incur as a result of this analysis. Individuals should consult with their personal financial advisors.
Tony Caldaro Archive |
© 2005-2022 http://www.MarketOracle.co.uk - The Market Oracle is a FREE Daily Financial Markets Analysis & Forecasting online publication.