Major Top in Gold this Year ? - Elliott 5th Wave Peak ?
Commodities / Forecasts & Technical Analysis Feb 28, 2007 - 06:23 PM GMTBy: Roland_Watson
Gold and silver were caught in the downdraft of selling on the stock exchanges today but having surged from last October's lows, a respite was always looming as the price increased.
However, the subject of this article is not the short-term movement of gold but where the next major sell point will be. There are various commentaries suggesting that gold will move fairly easily into quadruple digits with some breath to spare. I agree with these analysts that gold will move into four figures and then some. The only argument is when?
To put it briefly, I believe gold will move higher but there is coming a major correction to outdo all that has come before it since 1999. I think it will happen this year and we will after it have another great buying opportunity in gold and silver. However, to be caught in it without taking some money off the table could prove demotivating for some investors in the precious metals.
There are several reasons why this may be so. The first is that my own Silver Leverage Indicator is refusing to drop with any vigour. The second is the Elliott Wave analysis of gold.
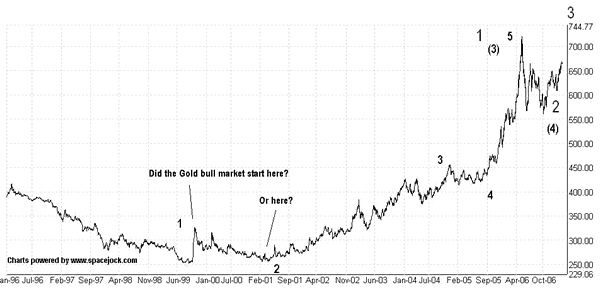
The issue lies in Elliott Wave analysis and when this gold bull market actually started. Did it begin in 1999 with the Washington Gold Agreement or later in 2001? The answer is crucial and affects the overall analysis. A typical Elliott Wave analysis based on a 1999 start may look like the chart below.

The gold bull starts at wave 1 in 1999 and progresses on to our recent highs of $731 with the ensuing correction. The alternate counts for waves 3 and 4 are given in parentheses. So, according to the main wave count here, the good times are just starting for gold with a higher degree wave 3 at the top right of the chart.
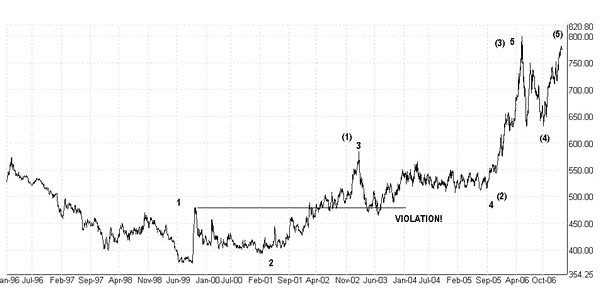
Okay, that may be acceptable but a couple of thoughts were nagging at me. The first was brought when I examined the same gold chart in Canadian dollars. The reason I bring up this chart is because if this is a real gold bull market, it will be international. And if it is international, we should expect similar wave counts in other currencies. If we don't the wave count is brought into question.

Note that if we follow the same pattern for the "Loonie" we run into trouble. A major rule of classical Elliott Wave is that the lowest price of wave 4 cannot be less than the highest price of wave 2. In other words, wave 4 cannot intrude into wave 2 territory. In this chart it clearly does as it cuts below the "VIOLATION!" line. In fact, if this were an OHLC chart, the incursion would be even more noticeable.
In that light, we reject the main wave numbering for the ones in parentheses. In the new number scheme, the wave follows the preferred guideline called "alternation" where Waves 2 and 4 usually alternate between Zigzag and Flat or between a Triangle and a Flat. Moreover, wave 3 is the longest wave and is not the shortest (which would be another rule violation).
Now some may object to this by saying that in this enlightened age is okay for waves 2 and 4 to cohabit. I do not accept this relaxation of the rules mainly because the less rules there is the more ambiguous the wave patterns will be with subsequent false sell and buy signals.
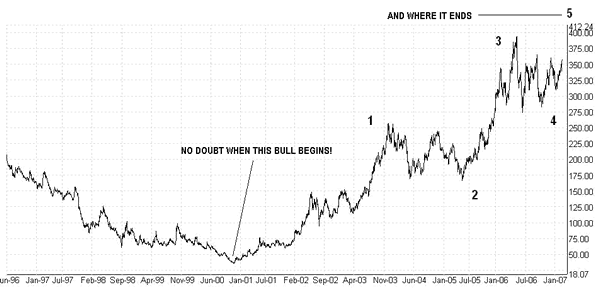
But one more clinching argument comes from the world of gold stocks. When did the bull market in gold mining stocks begin? A look at the HUI chart below leaves us in no doubt to that answer.

The Elliott wave pattern on the HUI is pretty clean with a final wave 5 in the offing. Wave 3 only lasted one year and we don't expect much more of wave 5 as it spikes to end phase one of the 30-year gold bull market. I also expect it to at least match wave 3, but in the madness of a final buying frenzy, who knows?
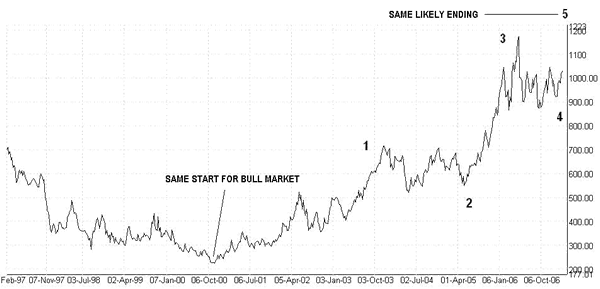
To confirm that HUI wave count, I also include the venerable Barron's Gold Mining Index for the same period (see chart below). Wave 3 is greater in size than wave 1 but again, we wonder where the final wave 5 will end? We note that the Barron's Index set all time high back in 1980 of nearly 1300. So far, 1175 is the highest closing weekly price.

So, an expected end to the first stage of the great gold bull is approaching this year. That of course is only my opinion but we think that the other indicators are pointing that way too. What about that vicious correction I talked about? Since the degree of correction will be less than the higher one that started the great gold bear of 1980-2001 but more than the ones we have witnessed since 2001, we think it will lie somewhere in between. I think you may agree that is a correction worth taking some money off the table for. The task before us is deciding where that top may be. That is where we hope other indicators will help, but that is another subject.
But once it hits bottom in 2008 or 2009, all I can say is keep that money handy, you'll be needing it again to load the gold and silver boat again!
By Roland Watson
http://silveranalyst.blogspot.com
Further analysis and comment on the silver market can be read in the subscriber-only Silver Analyst newsletter described at http://silveranalyst.blogspot.com where readers can obtain the first issue free. Comments and questions are also invited via email to silveranalysis@yahoo.co.uk .
© 2005-2022 http://www.MarketOracle.co.uk - The Market Oracle is a FREE Daily Financial Markets Analysis & Forecasting online publication.


