


Soaring U.S. Crude Oil Storage - Set to Pass 400 Million Threshold
Commodities / Crude Oil Nov 30, 2013 - 10:16 AM GMTBy: EconMatters

 Trend is to Store more Oil
A year ago oil in storage stood at 274 million barrels, and with another robust year of domestic production, and despite curtailed imports, the US Oil Inventory stands at 391 million barrels and climbing.
We are still technically in the building season for oil supplies which peaked in late May just shy of 400 Million Barrels, before the drawing season kicked off with the exporting of gasoline through increased refinery utilization led by the gulf coast refiners with their increased capacity to take advantage of the spread differential and cheaper operational energy in natural gas to export refined products more competitively than peer nations.
New Records Coming Soon
The domestic need for refined products was stagnant at best, the real demand was in the export market, without a robust export market for refined products, oil supplies would have crushed the 400 Million Barrier this summer, and prices at the pump would have been much cheaper here stateside.
So the drawing season accounted for roughly a 40 million barrel retracement in US supplies, and we are not even close to the middle of the building season, which even by conservative estimates should continue until mid-March of 2014.
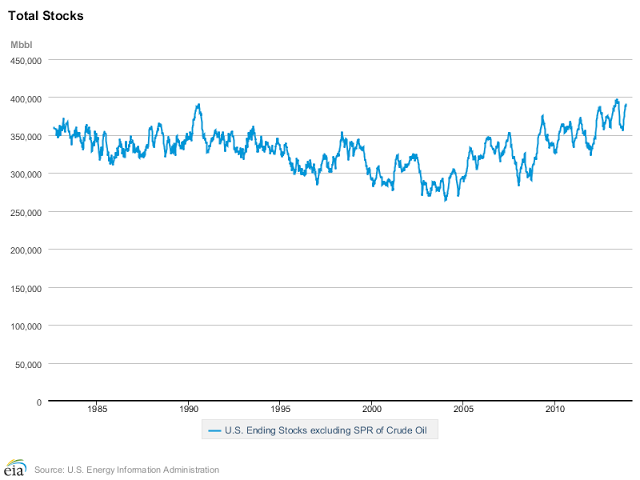
We might have some year-end selling of US inventories due to tax reasons, especially in Texas, but after all is said and done, if we go by the recent historical barometer of last year where we added roughly 25 million barrels of oil supplies to inventories, this puts supplies around the 416 Million Barrels of Oil level in the heart of the building season.
If domestic production continues ahead of pace and imports are not properly managed then maybe 425 Million Barrels in storage is possible, all modern records at this point in the data.
Fundamentals & Price: A Path Less Traveled in Recent Years
What effect this has on Oil prices is an entirely different matter as the Oil market is one of the most manipulated markets in the trading world, just look at the Brent-WTI Spread Trade this year for proof of that, and over the last 4 years for that matter.
All markets are pretty bad these days when it comes to market shenanigans, and when the Federal Reserve has basically gotten into the business of artificially created wealth through artificially pushing up asset prices all bets are off when it comes to predicting price adhering to fundamentals in the marketplace.
Fundamentals have become irrelevant in most markets these days. But some of us analyst types like to do fundamental analysis just for old time`s sake, who knows it might become a useful tool again sometime in the future once markets lose this unprecedented liquidity injection phenomenon.
Domestic Production
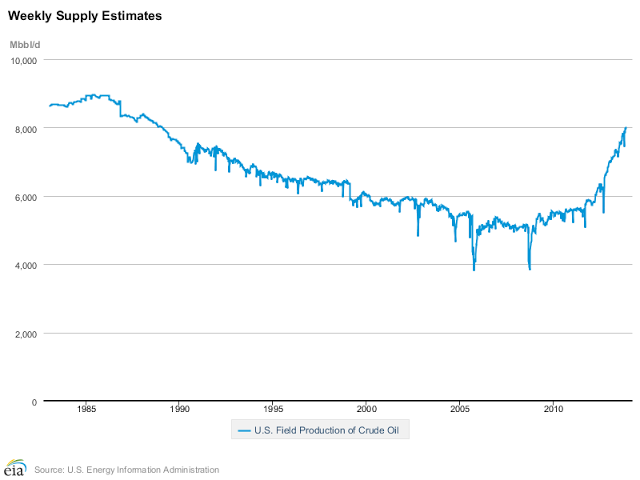
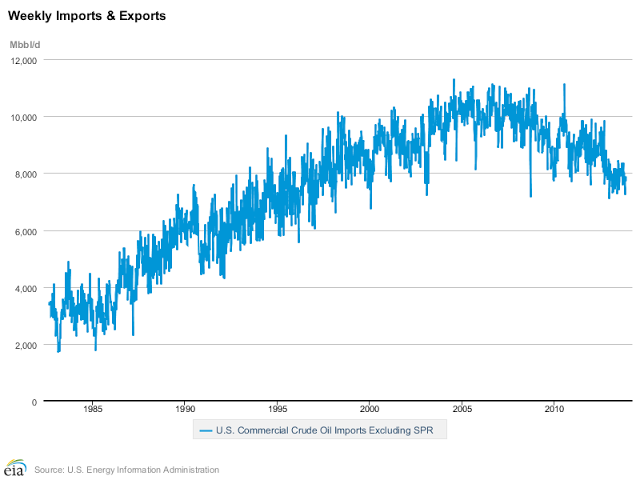
In looking at Domestic production, the US produces over 8 million barrels per day compared with 6.8 million this time last year, quite a significant jump year on year, and ahead of where my most optimistic forecast was for this metric earlier in the year in March of 2013. This increase in Domestic production is being offset by a reduction in Oil imports with the US importing 7.7 Million barrels per day versus over 8.1 million barrels this time last year.
Managing Imports
So the goal is to control supplies through managing imports to align with the substantial increases in Domestic production over the last several years, and this trend continues to play out at present. How far this strategy can go before world oil prices start reacting with considerable downward pressure is anybody`s guess but definitely something to keep track of in 2014.
But the last several months have had several weeks where Domestic production is more than Imports, and this milestone is quite an achievement for an ‘Outsourcer’ Nation with its core economic strategy of the last 30 years for goods and services.
2014 & Oil Metrics
Thus if we go by recent historical trends is the 9 million barrels per day of Domestic Oil production really possible for 2014? Can the US hit the 9.5 Million Barrel per day mark? And if so what does this mean for Global Oil prices?
All these dynamics will be worth watching in 2014, to be sure there are other factors revolving around China, Iran and Venezuela not to mention Saudi Arabia`s strategy in regard to Oil production, but nonetheless 2014 ought to be an interesting one for the Oil Market.
By EconMatters
The theory of quantum mechanics and Einstein’s theory of relativity (E=mc2) have taught us that matter (yin) and energy (yang) are inter-related and interdependent. This interconnectness of all things is the essense of the concept “yin-yang”, and Einstein’s fundamental equation: matter equals energy. The same theories may be applied to equities and commodity markets.
All things within the markets and macro-economy undergo constant change and transformation, and everything is interconnected. That’s why here at Economic Forecasts & Opinions, we focus on identifying the fundamental theories of cause and effect in the markets to help you achieve a great continuum of portfolio yin-yang equilibrium.
That's why, with a team of analysts, we at EconMatters focus on identifying the fundamental theories of cause and effect in the financial markets that matters to your portfolio.
© 2013 Copyright EconMatters - All Rights Reserved Disclaimer: The above is a matter of opinion provided for general information purposes only and is not intended as investment advice. Information and analysis above are derived from sources and utilising methods believed to be reliable, but we cannot accept responsibility for any losses you may incur as a result of this analysis. Individuals should consult with their personal financial advisors.
EconMatters Archive |
© 2005-2022 http://www.MarketOracle.co.uk - The Market Oracle is a FREE Daily Financial Markets Analysis & Forecasting online publication.