


Stock Market Primary Wave III Rally Over?
Stock-Markets / Stock Markets 2013 Dec 15, 2013 - 02:35 PM GMTBy: Tony_Caldaro

 After hitting a rebound high at SPX 1812 early Monday the market experienced its first real, (not a point or two), week over week decline since late September. And its largest weekly decline since the last downtrend. For the week the SPX/DOW were -1.65%, the NDX/NAZ were -1.45%, and the DJ World lost 1.45%. On the economic front positive economic reports again outpaced negative ones. On the uptick: wholesale/business inventories, retail sales, export/import prices, the monetary base, plus the budget deficit improved. On the downtick: the PPI, the WLEI and weekly jobless claims rose. Next week is FED week, plus we get reports on Capacity utilization, Housing and Q3 GDP. Should be an interesting week before the following holiday week.
LONG TERM: bull market
Two week ago, in the weekend update, we published a small write up on the DOW. You can read it here: http://caldaro.wordpress.com/2013/11/30/weekend-update-425/. The Friday that was written was, thus far, the actual uptrend high. We now have a few additional tidbits of information regarding that high. If one connects the 2000 top, the 2007 top and the recent high, one will notice the DOW ran into a 13 year overhead resistance trend line at that high.
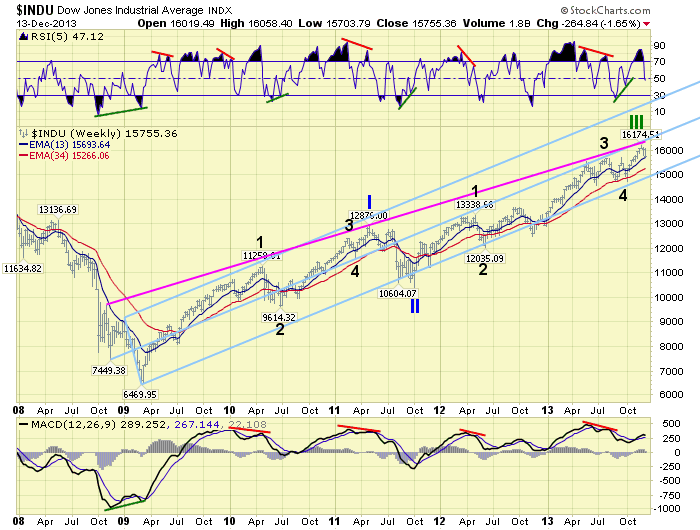
We updated the Fork chart posted in that report to make our next point. Notice a 5 year overhead resistance trend line was also hit at the DOW’s recent high. In addition to these trends lines the internal strength of the DOW has been weakening for six months, and is now displaying a double negative divergence. Just like it did at the Primary I high in 2011. When we add in the characteristics of this bull market, the negative divergence in NYSE market breadth, the over-extended positive portion of the 2 year Tech cycle, plus the negative divergences on the medium/long term charts. Some may conclude the bull market has topped. We do not, but Primary wave III may have topped. We still see this bull market concluding around March of 2014.
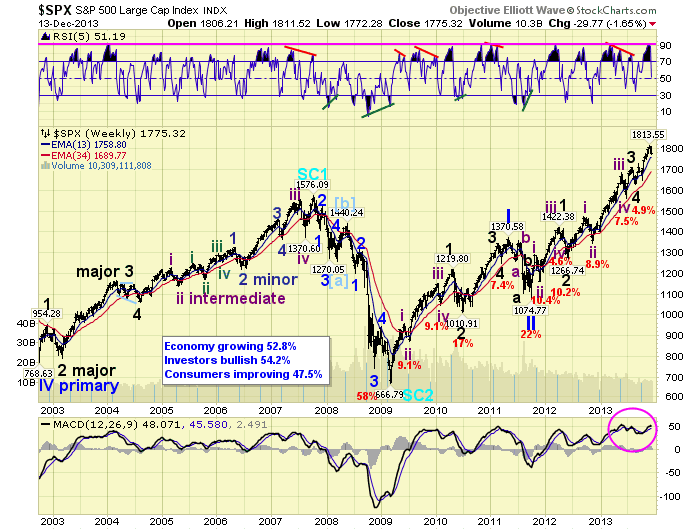
We continue to count this bull market as Cycle wave [1] of the new Super cycle SC 3 bull market. Cycle wave bull markets unfold in five Primary waves. Primary waves I and II completed in 2011. Primary wave III may have just recently completed, or Major wave 5 will subdivide just like Major waves 1 and 3 of Primary III. The next downtrend should be the deciding factor for a normal bull market ending early next year. Or a blow off bubble bull market ending at some future date.
Notice on the chart above the recent overbought condition in the RSI topped where many of the other uptrends have topped. Also observe the relative weakness in the MACD after such a good uptrend. If Primary III did conclude we would expect an extremely oversold condition in the RSI before a bottom, and a full retracement of the last uptrend, if not, the last two uptrends. If the latter is not accomplished then we are probably looking at a subdividing Major wave 5.
MEDIUM TERM: uptrend weakening
We have been counting from the August Major wave 4 low at SPX 1627 five Intermediate waves. The five waves unfolded as follows: 1730-1646-1775-1746-1814. We noted last week the key to a potential downtrend would be the overlapping of Int. wave iii at SPX 1775. That occurred this week. In fact we ended the week right at that level.
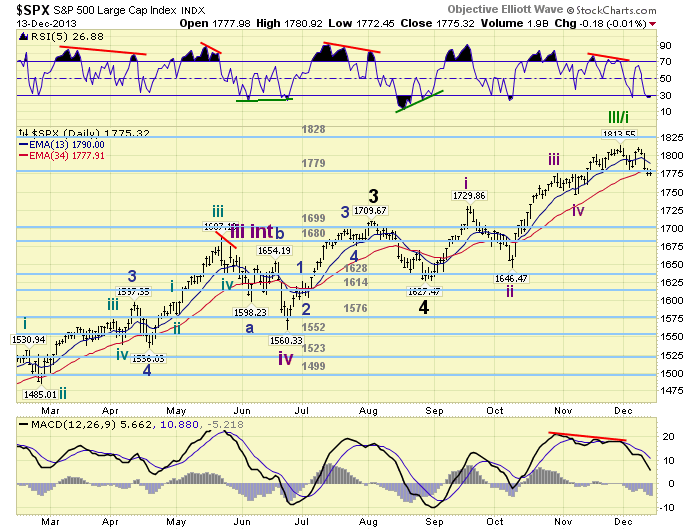
Since that five wave advance had a weak fifth wave, any downtrend would fine support in the SPX 1646 to SPX 1730 range. Should Major wave 5 be subdividing this is probably where the downtrend would end. If not, we would then expect the market to drop below SPX 1627 and possibly find support at SPX 1560. This could be an interesting couple of months. Medium term support is now at the 1699 and 1680 pivots, with resistance at the 1779 and 1828 pivots.
SHORT TERM
From the Int. wave iv low at SPX 1746 we counted five Minor waves up: 1773-1761-1802-1777-1814. We had been noting any pullback to SPX 1777 would fully retrace Minor 5 suggesting those five waves had completed. That occurred early Thursday of this past week. Later in the day the Int. wave iii high at SPX 1775 was also breached. Suggesting the entire advance from the August low has completed.
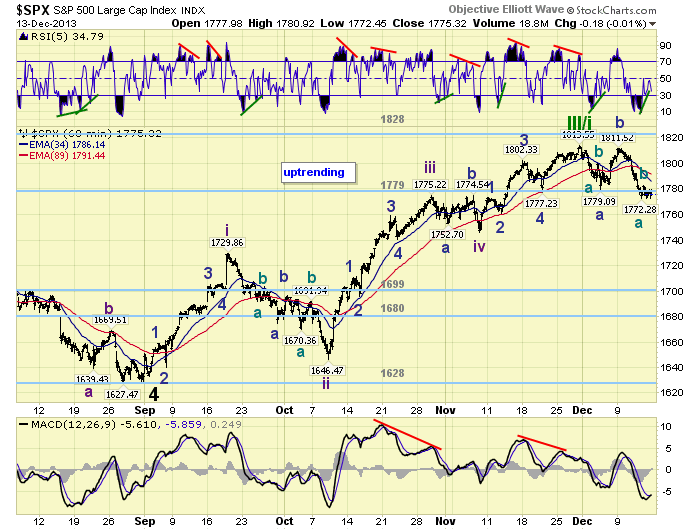
Since we are now expecting, probabilities 55%/45%, the next/current downtrend to be Primary wave IV. The wave labeling from the SPX 1814 was adjusted down one degree. Primary wave downtrends unfold in three Major waves, with each declining Major wave three Intermediate waves. Thus far we can count Minor a: 1786-1800-1779, Minor b: 1796-1783-1812, and Minor c: 1772-1783-1772 so far. If Minor c ended at SPX 1772, this would complete Intermediate wave A. And the market could rally into the SPX 1790′s. If not, and the market continues its decline below SPX 1772 the next support is probably around 1746.
Short term support is at SPX 1746 and SPX 1730, with resistance at the 1779 pivot and SPX 1814. Short term momentum continues to display a positive divergence. The short term OEW charts remain negative with the reversal level now SPX 1786. Best to your trading the last full trading week of the year!
FOREIGN MARKETS
The Asian markets were nearly all lower on the week for a net loss of 1.1%. Four of the eight indices we track are in confirmed downtrends.
The European markets were all lower on the week for a net loss of 1.9%. Seven of the eight indices we track here all in confirmed downtrends.
The Commodity equity group were all lower on the week for a loss of 1.1%. All three here are in confirmed downtrends.
The DJ World index is now in a confirmed downtrend for the first time since June, and it lost 1.45% on the week. Currently 70% of the world’s indices are in confirmed downtrends.
COMMODITIES
Bonds continue to downtrend losing 0.8% on the week.
Crude is still uptrending but lost 1.4% on the week.
Gold is still in a downtrend but gained 0.7% on the week.
The USD continues to downtrend losing 0.1% on the week.
NEXT WEEK
A busy one indeed. Monday: the NY FED at 8:30, then Capacity utilization at 9:15. Tuesday: the CPI, Current account balance, and NAHB housing. Wednesday: Housing starts, Building permits and the FED’s FOMC statement/press conference. Thursday: weekly Jobless claims, Existing home sales, the Philly FED and Leading indicators. Friday: Q3 GDP (est. +3.6 to +3.7%), and Options expiration. As for the FED, chairman Bernanke will give brief remarks Monday at the FED’s centennial celebration at 2pm. Best to your week and holiday season!
CHARTS: http://stockcharts.com/public/1269446/tenpp
http://caldaroew.spaces.live.com
After about 40 years of investing in the markets one learns that the markets are constantly changing, not only in price, but in what drives the markets. In the 1960s, the Nifty Fifty were the leaders of the stock market. In the 1970s, stock selection using Technical Analysis was important, as the market stayed with a trading range for the entire decade. In the 1980s, the market finally broke out of it doldrums, as the DOW broke through 1100 in 1982, and launched the greatest bull market on record.
Sharing is an important aspect of a life. Over 100 people have joined our group, from all walks of life, covering twenty three countries across the globe. It's been the most fun I have ever had in the market. Sharing uncommon knowledge, with investors. In hope of aiding them in finding their financial independence.
Copyright © 2013 Tony Caldaro - All Rights Reserved Disclaimer: The above is a matter of opinion provided for general information purposes only and is not intended as investment advice. Information and analysis above are derived from sources and utilising methods believed to be reliable, but we cannot accept responsibility for any losses you may incur as a result of this analysis. Individuals should consult with their personal financial advisors.
Tony Caldaro Archive |
© 2005-2022 http://www.MarketOracle.co.uk - The Market Oracle is a FREE Daily Financial Markets Analysis & Forecasting online publication.