


Stock Market Options Triple Witching vs Santa Rally Explained
Stock-Markets / Options & Warrants Dec 17, 2013 - 03:39 PM GMTBy: J_W_Jones

 With the last major news item for 2013 less than 48 hours away, I thought I would share some insights as to what the S&P 500 Cash Index (SPX) options were pricing into the Federal Reserve’s monetary policy announcement due out Wednesday.
After the news is released and the week ends, it will be time for Santa Claus to come to Wall Street. While most people believe in the Santa Claus rally, what few understand is the bullish undertones that traditionally accompany a triple witching event.
This coming Friday, is a triple expiration. Equity options, index options, and futures contracts will be expiring this Friday. This event is traditionally known as “triple witching” and historically the quarterly expiration event ushers in serious bullishness.
According to Bank of America Merrill Lynch, “In the 31 years since the creation of equity index futures, the S&P500 has risen 74% of the time during this week. More recently, it has risen in ten of the past 12 years.” The chart shown below was posted on zerohedge.com and was provided by Bank of America Merrill Lynch.
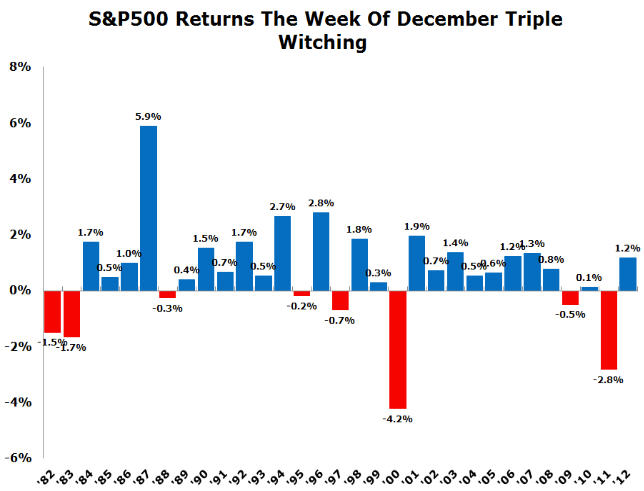
The chart above clearly demonstrates that the December triple witching event is statistically relevant for higher prices. What many call the “Santa Claus Rally” may have more to do with triple witching than whether Wall Street was naughty or nice.
The data above would demonstrate that unless the Federal Reserve either shocks the market or initiates a tapering of their quantitative easing program, we are likely to see some strong bullish price action in stocks going into the end of the year. Trend following quantitative trading strategies are a great way to automated your trading or investing.
While it can be argued as to whether or not a tapering has been fully priced in, what is of keen interest to me is whether SPX option analysis confirms a bullish disposition for future price action.
I want to be clear, that as an option trader I am constantly looking at probabilities for trade selection. I use a variety of credit spreads to take advantage of higher than normal implied volatility and use the passage of time as an additional profit engine. Additionally I use probabilities to help me select the option strikes that I am going to utilize for trade structures.
Based on the closing prices in the December Monthly (Exp. 12/20/13) S&P 500 Cash Index (SPX) on Monday December 16, 2013 the marketplace is pricing in a fairly tight short-term range. This is to be expected when time to expiration (in this case 4 days) is fairly short in duration. However, when we look at the standard deviation analysis from Monday’s close an interesting narrative is born.
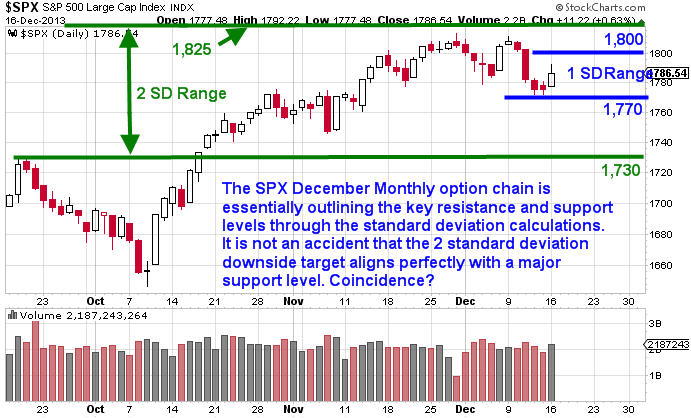
The 1 standard deviation (68% probability) price range in SPX based on Monday’s close is around 1,770 – 1,800. The SPX option market is pricing in that there is a 68% chance that by the close Friday the SPX price will be in that range. However, the 2 standard deviation (90% Probability) price range tells a considerably different story.
The December Monthly SPX options show a 2 standard deviation range between 1,730 – 1,825. There is a 90% probability that at Friday’s close price will be in that range. However, when we look closer something interesting is revealed.
The Monday closing price for the SPX was 1,786.50. I would simply point out that the SPX options marketplace is saying that the risk of a larger move to the downside is more likely. Note that the 2 standard deviation upside price level is roughly 40 points higher than Monday’s closing price.
The 2 standard deviation downside range is more than 55 points lower. The marketplace is clearly pricing in that should a price shock take place, it will be much more devastating if prices move lower on the Federal Reserve’s statement. The price range is shown below on the SPX daily chart.
The fact that the option market is clearly favoring more downside potential does not mean that the marketplace’s reaction will force prices lower. The extra risk premium to the downside exists because the marketplace believes that there is more downside risk potential.
Unfortunately the SPX December monthly option chain cannot tell us much more at this point in time about future price action. However, some analysis provided by Bank of America Merrill Lynch solidifies my expectations that in the immediate short-term more downside is likely. However, a major bottom is likely to form which coincides with the December triple witching event. The chart below is courtesy of Bank of America Merrill Lynch.
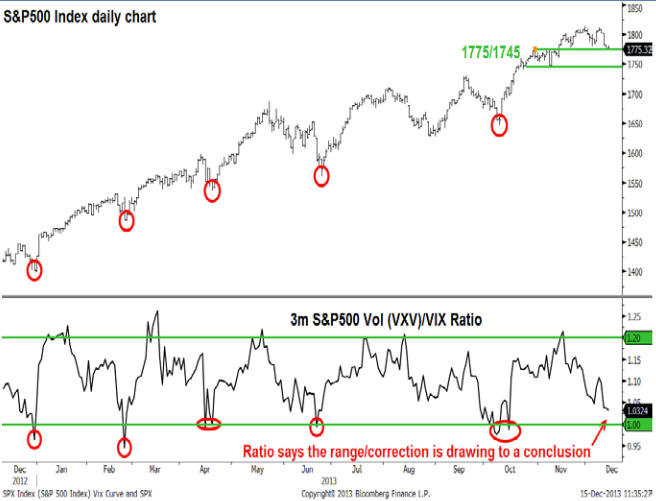
The chart above demonstrates that the target range is somewhere between 1,745 and 1,775. In overnight futures trading on Sunday evening prices fell sharply, but Monday’s action caused prices to regain their footing. The recent lows in the SPX just barely made it into the range highlighted above. My guess is that one more pullback may occur before we see prices start moving higher due to triple witching and seasonality.
However, what is most important for readers to understand is that the risk should the Federal Reserve surprise the marketplace with a more hawkish action could be quite bearish in nature. A tapering announcement or a larger than anticipated tapering could cause the S&P 500 Index to react violently to the downside.
I will be the first to admit I have no idea what is going to happen, but I think hedging longs or taking some profits where available makes sense ahead of the Federal Reserve’s statement. While higher prices are more obvious based on seasonality and the binary triple witching event, a downside move could catch market participants off guard and strong short-term selling could result. Short-term risk is high!
Start Options Trading Right In 2014 With Options Trading Signals!
Give OptionsTradingSignals.com a try today!
J.W. Jones is an independent options trader using multiple forms of analysis to guide his option trading strategies. Jones has an extensive background in portfolio analysis and analytics as well as risk analysis. J.W. strives to reach traders that are missing opportunities trading options and commits to writing content which is not only educational, but entertaining as well. Regular readers will develop the knowledge and skills to trade options competently over time. Jones focuses on writing spreads in situations where risk is clearly defined and high potential returns can be realized.
This article is intended solely for information purposes. The opinions are those of the author only. Please conduct further research and consult your financial advisor before making any investment/trading decision. No responsibility can be accepted for losses that may result as a consequence of trading on the basis of this analysis.
© 2005-2022 http://www.MarketOracle.co.uk - The Market Oracle is a FREE Daily Financial Markets Analysis & Forecasting online publication.