US Stock Market Top Forecast
Stock-Markets / Stock Markets 2013 Dec 27, 2013 - 11:23 AM GMTBy: John_Hampson
 Time for another run through the checklist of typical cyclical bull tops in stocks.
1. Market valuation excessive
Second highest market cap to GDP valuation outside of 2000, the 4th highest Q ratio valuation and 4th highest CAPE valuation in history, last two years gains more than 80% multiple expansion and less than 20% earnings growth – CHECK
2. Evidence of overbought and overbullish extremes
II bears highest since 1987, II bulls highest since October 2007, CS Risk Appetite US model into Euphoria; Citi Panic/Euphoria model into Euphoria; Put/Call ratio at extreme low; Second highest ever Skew reading; Greedometer at extreme; Margin Debt at all-time record; Twitter up 80% in a month to a $40bn market cap despite zero profits – CHECK
3. Major distribution days near the highs
In total in 2013 we have had just one major accumulation day and seven major distribution days, which is divergent and atypical for a bull year; We should see further distribution days once the current melt-up breaks – WATCH
4. Rolling over of leading indicators
ECRI WLI is in a downtrend, OECD-derived leading indicators and narrow money point to a topping out at the turn of the year, whilst CB and Markit leading indicators still show strength – MIXED
5. Excessive Inflation
No, we are instead flirting with deflation, in line with demographics trends, which is a potentially bigger threat to a stocks bull but historically atypical. However, commodities remain on the cusp of a potential breakout and a potential typical late cyclical outperformance, whilst the US dollar is potentially flirting with breakdown, which together could provide a short inflation shock; If commodities instead break down, then that should ensure the drop into deflation – WATCH
6. Tightening Of Rates
We see this in the recent sharp rise in treasury yields, touching 3% yesterday; This development is echoed in bond yield rises in both developed and emerging markets globally; Plus China is actively trying to reign in its credit excesses by tightening, which led to the recent cash crunch issues – CHECK
6. Cyclical sectors topping out before the index top and money flow into defensives
This bull market has been dominated by flows into low-beta, dividend paying defensives, which again reflects demographic choices, whilst cyclicals have been more shunned, thus making this indicator less potent – so more N/A
7. Market breadth divergence
We see some breadth divergences in stocks above 200MA in place now for several months, whilst similar divergence in Advance-Declines has been reset by the strong rally of the last two weeks – MIXED
8. A Topping Process/Pattern – I want to focus on this, so:
We see evidence of a ‘blow off top’ pattern. Parabolic shape on the indices long term view. Corrections increasingly shallow. Permabears capitulating and converting to bulls. Perception market can only go in one direction. Euphoria.
Blow off tops increase the likelihood of a crash, rather than a more leisurely ‘topping process’ range. There are some well known examples from history, and they display a similar technical unfolding to each other.
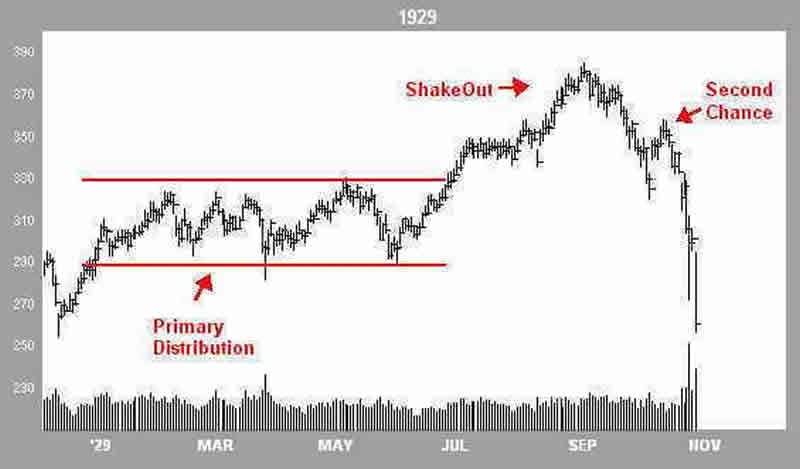
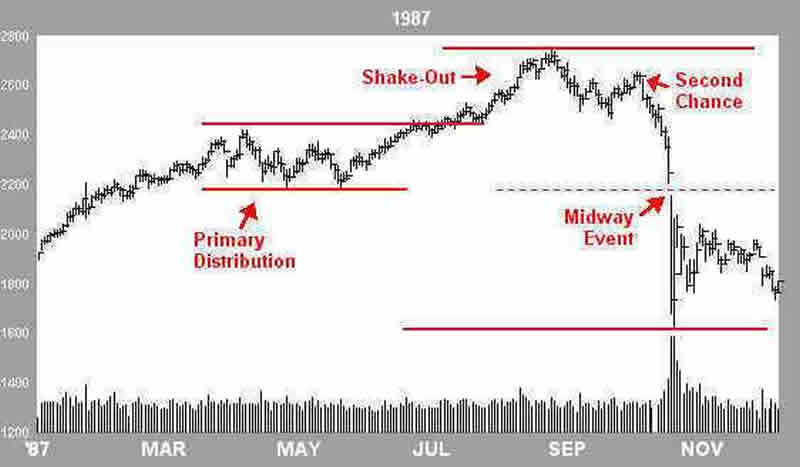
Source: Financial-Spread-Betting. Their labelling, but others might recognise the pattern as a kind of wedge-overthrow-top, or a blow off top, where the final rally beyond the consolidation range is the blow-off part, characterised by euphoria and capitulation.
We see a similar pattern unfolded into the Nasdaq’s 2000 peak, and also on the Nikkei’s 1989 top:
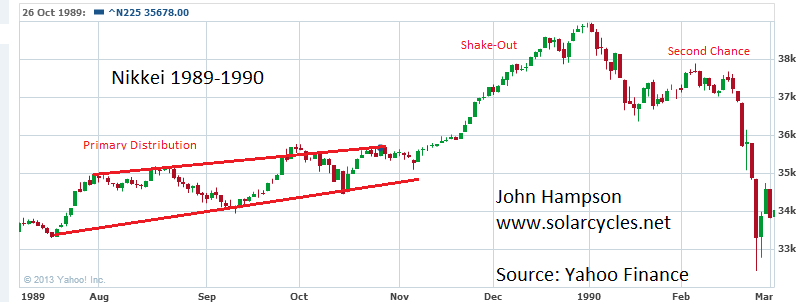
On a longer term view, we see a parabolic rise and collapse, but it’s in the Daily view action prior to the collapse that we see the clues in the pattern.
The Dow today:
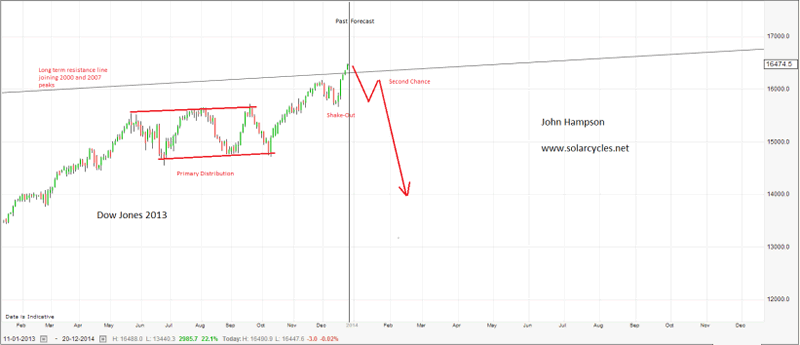
The pattern is there, the euphoria is there. A little more breadth divergence would be more compelling, but this could potentially accumulate into the ‘second chance’ point.
So increased chance of a market crash ahead, and if we draw on history again then the combination of a sharp sell-off together with the record high leverage extremes currently in play (margin debt, Rydex), suggest an episode of forced-selling and margin-calls similar to 2008 or 1929, where little will be spared.
Here is the bigger picture for the 1929 crash. Note that all assets sold off together in the crash down to where I have marked a blue circle. After that, gold stocks took off and diverged from the bulk of equities which progressed into a bear market.
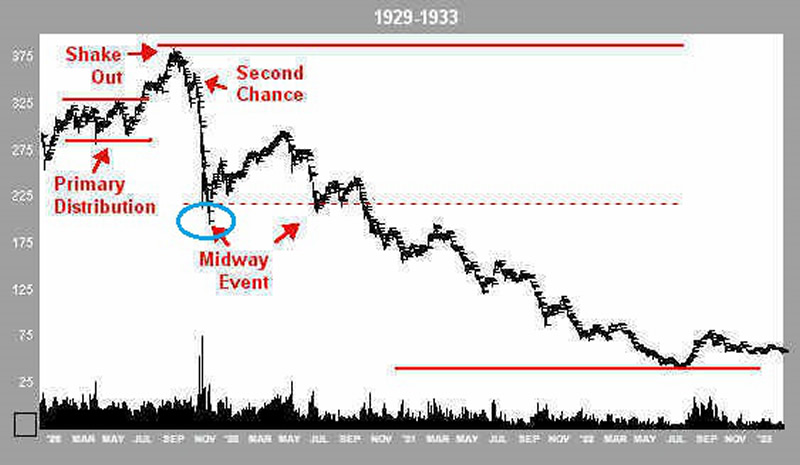
Source: Financial-Spread-Betting
Therefore, although I expect precious metals and miners to return to a bull market as equities top out here, we have to be aware that a market crash could see EVERYTHING sell off due to forced redemptions (1929, 1987, 2008), before PMs can take off in earnest.
John Hampson, UK / Self-taught global macro trader since 2004
www.solarcycles.net (formerly Amalgamator.co.uk) / Predicting The Financial Markets With The Sun
© 2013 Copyright John Hampson - All Rights Reserved Disclaimer: The above is a matter of opinion provided for general information purposes only and is not intended as investment advice. Information and analysis above are derived from sources and utilising methods believed to be reliable, but we cannot accept responsibility for any losses you may incur as a result of this analysis. Individuals should consult with their personal financial advisors.
© 2005-2022 http://www.MarketOracle.co.uk - The Market Oracle is a FREE Daily Financial Markets Analysis & Forecasting online publication.


