


Looking Back at the Year of the Stocks Bull Market 2013
Stock-Markets / Stock Markets 2013 Jan 01, 2014 - 04:21 AM GMTBy: Frank_Holmes

 I've often said that trying to stop a bull market has risks. It was certainly precarious to think this year's run would end anytime soon.
By December 27, the S&P 500 Index climbed an astounding 31.86 percent in 2013. We're also pleased that shareholders in U.S. Global Investors' All American Equity Fund (GBTFX) and Holmes Macro Trends Fund (ACBGX) were along for the ride and more this year, as both funds outperformed their respective benchmarks. Check out their performance here.
 Will stocks continue to climb in 2014? Odds are "very good," finds BCA Research. According to historical data going back to 1870, there were 30 times when annual returns in domestic stocks climbed more than 25 percent. Of these, 23 experienced an additional increase, resulting in a mean of 12 percent, says BCA.
Thinking back to January 2013, investors had a very different frame of mind. While we recently talked about the year's biggest stories in U.S. energy and gold, we want recap our popular commentaries focused on the domestic market.
Dow to 14,000 ... And Beyond? (February 5, 2013)
After January saw the best month in two decades for U.S. stocks, I wrote how sentiment was slowly improving as many uncertainties had been removed from the market. I gave three reasons to stay positive on equities:
- U.S. businesses and households were deleveraging
- New home sales were expected to increase
- Inflation was low
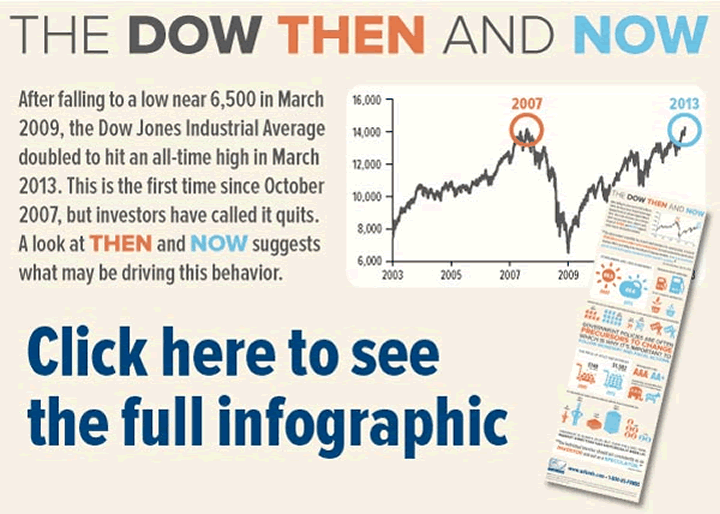
Dow, Now and Then (March 12, 2013)
It wasn't long before the Dow was hitting highs, yet with elevated unemployment, dysfunction in Washington and ongoing negative news about the U.S. economy, we noted that investors weren't celebrating. There were plenty of reasons for that: In an infographic that was retweeted by Jim Cramer, we visually compared the Dow, then and now.
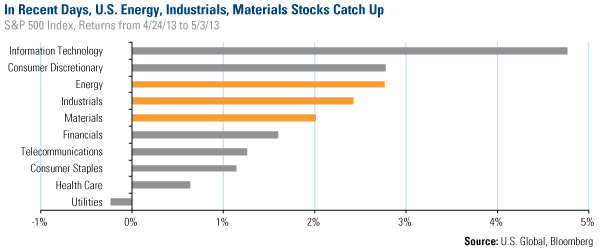
Don't Sell in May: Here are Reasons to Extend Your Stay (May 6, 2013)
By the end of April, we noted that formerly weaker areas of the market were gaining strength. From April 24 through May 3, health care, consumer staples, utilities and telecommunications sectors lagged, while energy, industrial and materials stocks were nearly the best performing areas of the market.
This turned out to be a significant inflection point in the market, with cyclical stocks gaining strength over the next several months. Read the article here.
Don't Miss This Golden Cross in Resources (November 4, 2013)
While investors were focused on the strengthening U.S. market, we noted improving indicators in other areas, including resources, Europe, and emerging markets. Notably, the global synchronized easing continued to take place along with improving purchasing manager's index (PMI) number in many countries. Historically these factors bode well for commodities and commodity stocks. Read how you can "count on" PMIs here.
While many of these areas of the market were not as widely popular as U.S. stocks, we believed investors could benefit from being contrarian. Read the article now.
As we wrap up the year, the benchmark 10-year Treasury note's yield rose above 3 percent, touching the highest level in more than two years. An increase in bond yields can be both good and bad. According to ISI, a bad increase in bond yields is related to tapering concerns. A good increase in bond yields is related to the economy strengthening. "The two are intertwined, so it's difficult to know which is dominating. However, judging by the S&P, a Good Increase currently has the upper hand," says ISI. Our focus on global PMI numbers as early indicators of economic strengthening relates to this view.
The "good increase" in Treasury yields means a return to a positive real interest rate environment which is, historically, a headwind for gold prices.
We wish you a joyous, healthy and prosperous New Year!
What do you think will be the biggest stories in the new year? We'd like to know your predictions, questions and resolutions for 2014. Email us at editor@usfunds.com.
By Frank Holmes
CEO and Chief Investment Officer
U.S. Global Investors
U.S. Global Investors, Inc. is an investment management firm specializing in gold, natural resources, emerging markets and global infrastructure opportunities around the world. The company, headquartered in San Antonio, Texas, manages 13 no-load mutual funds in the U.S. Global Investors fund family, as well as funds for international clients.
All opinions expressed and data provided are subject to change without notice. Some of these opinions may not be appropriate to every investor.Standard deviation is a measure of the dispersion of a set of data from its mean. The more spread apart the data, the higher the deviation. Standard deviation is also known as historical volatility. All opinions expressed and data provided are subject to change without notice. Some of these opinions may not be appropriate to every investor. The S&P 500 Stock Index is a widely recognized capitalization-weighted index of 500 common stock prices in U.S. companies. The NYSE Arca Gold BUGS (Basket of Unhedged Gold Stocks) Index (HUI) is a modified equal dollar weighted index of companies involved in gold mining. The HUI Index was designed to provide significant exposure to near term movements in gold prices by including companies that do not hedge their gold production beyond 1.5 years. The MSCI Emerging Markets Index is a free float-adjusted market capitalization index that is designed to measure equity market performance in the global emerging markets. The U.S. Trade Weighted Dollar Index provides a general indication of the international value of the U.S. dollar.
Frank Holmes Archive |
© 2005-2022 http://www.MarketOracle.co.uk - The Market Oracle is a FREE Daily Financial Markets Analysis & Forecasting online publication.