Stock Market Bubble Valuation - Hear the Bear Growl?
Stock-Markets / Stock Market Valuations Jan 13, 2014 - 10:50 AM GMTBy: LewRockwell

[S]tock prices have risen pretty robustly. But I think that if you look at traditional valuation measures, the kind of things that we monitor, akin to price-equity ratios, you would not see stock prices in territory that suggests bubble-like conditions.
- Janet Yellen, responding to a question in November’s nomination hearing
We offered our take on stock valuation several times last year, while arguing that traditional price-to-earnings multiples (P/Es) are almost useless during periods of heavy policy stimulus. We’ll take a different direction here, by suggesting a “fix” for an entirely different problem with traditional P/Es. Our analysis reveals three messages about current stock prices.
We’ll start with 100+ years of traditional P/Es based on trailing 12 month earnings:
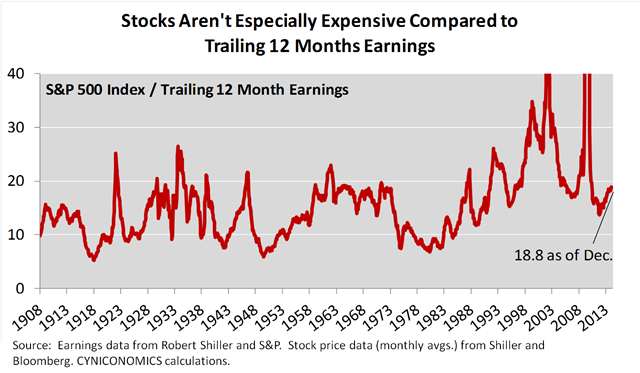
From this simple chart, analysts draw conclusions about whether valuation is high, low or neutral versus historic norms. One problem with that – and the motivation behind this post – is in the depiction of historic norms. Analysts typically weight periods of expanding earnings equally with periods of depressed earnings. But when earnings are depressed, P/Es tend to spike upwards as the earnings input to the denominator shrinks.
Unusual jumps in P/Es often occur in bear markets, as we saw during the Internet bust and again in the housing bust. In each of these instances, P/Es reached all-time highs despite the fact that stock prices were far below prior peaks. For example, when the S&P 500 plummeted below 700 in March 2009, P/Es climbed to a new record of 79, on their way to five consecutive months of over 100! (These results are cut off the chart for scaling purposes.)
Such distortions may make you wonder: Do P/Es during earnings recessions tell us anything at all about stock valuation?
Our answer is no.
As any Excel user who’s been foiled by a “#DIV/0” message knows, ratios demand careful attention when the denominator is volatile. In this case, a better approach is to divide equity prices by the highest earnings result from any prior 12 month period. (Dividing by trend earnings or 10 year average earnings is better still, but we’ll leave these methods for other posts.) This measure of “price-to-peak earnings” (P/PE) isn’t skewed by recessions because the denominator never falls.
Here’s the chart:
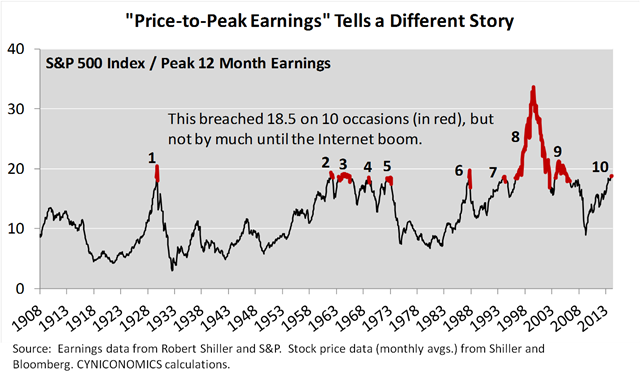
The last three data points (for October, November and December) are 18.2, 18.7 and 18.8. As of November, we reached a new high for the current bull market. What’s more, there are only nine comparable, historic episodes of P/PE climbing above 18.5 (as numbered on the chart). Combining these episodes with other statistics, we’ve identified three possible messages:
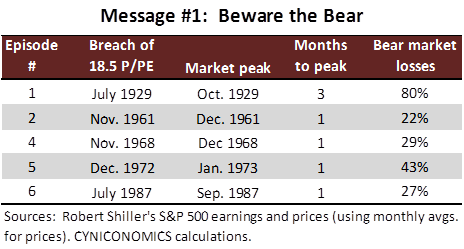
Message #1: Beware the bear (he’ll be here within a few months)
After five of the nine P/PE breaches of 18.5, a bear market began within the next three months (with four of the market peaks remarkably occurring in the very next month):
Message #2: Time to buy (earnings will bust through their prior peak)
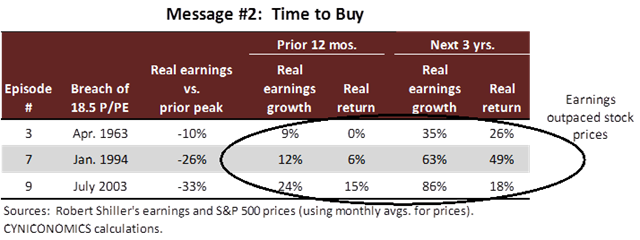
In three other episodes, earnings were accelerating and still hadn’t reached the peak of the previous earnings cycle. Each time, the P/PE breach of 18.5 was followed by three consecutive years of double-digit earnings growth, with stock prices rising strongly but still lagging earnings:
Message #3: Bull to bubble (prices will leave earnings behind)
In the remaining episode (1996), earnings had already breached their prior cycle peak and would soon level off. The bigger story after this P/PE breach of 18.5 was the dizzying rise in stock prices that would outpace earnings by a large margin. Here are the details, along with a comparison to circumstances as of last month:
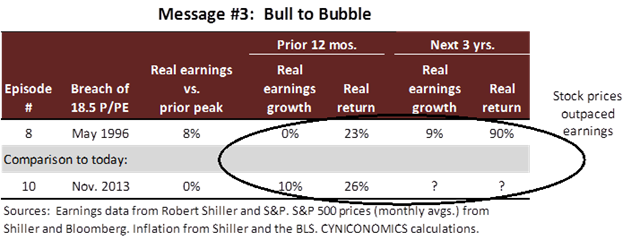
One way to interpret these results is to focus on the number of episodes linked to each of the three messages. That won’t be our approach.
We prefer to condition the results on two factors, one based on the earnings cycle and the other on the Fed. For the first factor, we look at whether earnings were accelerating upwards from below the prior cycle peak. For the second factor, we separate the Fed’s first eight decades (described according to the old-time philosophy of “taking away the punch bowl when the party gets going”) from the last two decades of Greenspan/Bernanke puts (based on the new philosophy of “refilling the punch bowl”).
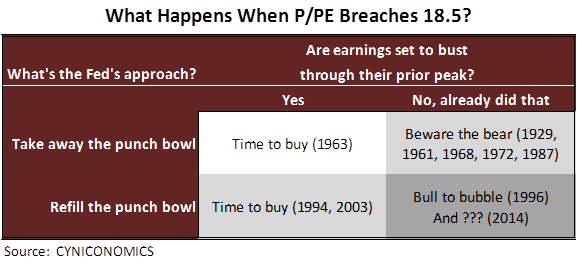
As you might guess from the grid, we’re not convinced that current P/PEs signal a bear market in 2014, despite the facts that:
- Five of nine instances (56%) of P/PE breaching 18.5 were closely followed by market peaks.
- When earnings are at all-time highs, five of six instances (83%) of P/PE breaching 18.5 were closely followed by market peaks.
Not only do we have to be careful about using price multiples for forecasting (as mentioned in earlier posts), but we currently sit in the grid’s lower right-hand quadrant with the Fed setting new standards for short-term market support. The only other P/PE breach of 18.5 belonging to this quadrant was in the early stages of the Internet bubble.
What’s more, recent earnings and stock performance match up more closely with the Internet bubble episode – as shown in the “Message 3” table – than with the episodes in the “Message 2” table.
So, are we predicting four years of soaring stock prices and nonsensical valuations, as in 1996 to 2000?
Not exactly.
The past can offer clues to the future but it doesn’t give us a blueprint. The bigger message is that today’s valuations don’t bode well for long-term returns, where long-term means beyond the next market peak. Prices could surely bubble upwards from here, but bubbles are invariably followed by severe bear markets. (We’ll expand on this outlook in a future post, where we’ll add total return estimates.)
More importantly, we shouldn’t be fooled by traditional valuation measures. P/Es, in particular, have several flaws. We’ve shown in past articles that we get completely different results when we adjust earnings to account for mean reversion. We made a separate adjustment here to correct for the distorting effects of earnings recessions. Either way, our conclusions are a far cry from the “nothing to see here” that we keep hearing from the Fed.
Reprinted with permission from Cyniconomics.com.
Copyright © 2014 Cyniconomics.com
Disclaimer: The above is a matter of opinion provided for general information purposes only and is not intended as investment advice. Information and analysis above are derived from sources and utilising methods believed to be reliable, but we cannot accept responsibility for any losses you may incur as a result of this analysis. Individuals should consult with their personal financial advisors.
© 2005-2022 http://www.MarketOracle.co.uk - The Market Oracle is a FREE Daily Financial Markets Analysis & Forecasting online publication.


