


Stock Market Primary Wave IV?
Stock-Markets / Stock Markets 2014 Jan 26, 2014 - 06:31 AM GMTBy: Tony_Caldaro

 The last two days, of a holiday shortened week, resulted in a nasty decline for the entire week. The market started Tuesday with a gap up opening, hitting SPX 1849 in the opening minutes. Then bounced around between SPX 1832 and 1847 by Wednesday’s close. Thursday, however, started with a gap down opening and the market continued to decline into Friday’s close. For the week the SPX/DOW were -3.05%, the NDX/NAZ were -1.55%, and the DJ World index lost 2.55%. Economic reports for the week were sparse. On the uptick: FHFA housing prices, leading indicators and the WLEI. On the downtick: existing home sales. Next week is a busy one. We have the FOMC meeting tues/wed, Durable goods orders, the Chicago PMI, and Q4 GDP. Best to your week.
LONG TERM: bull market
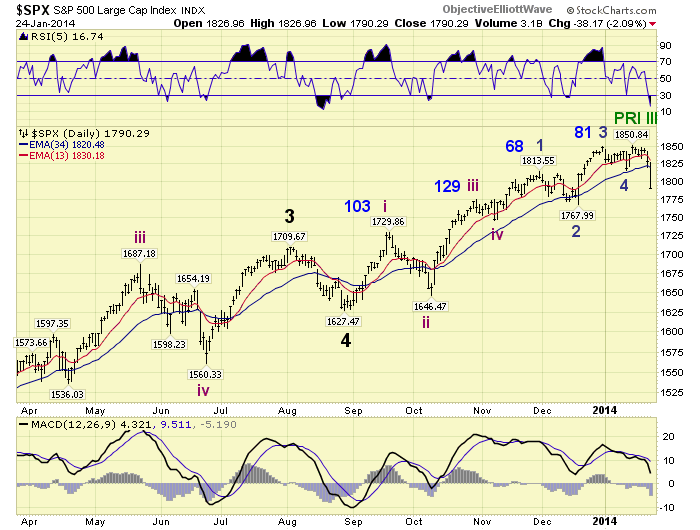
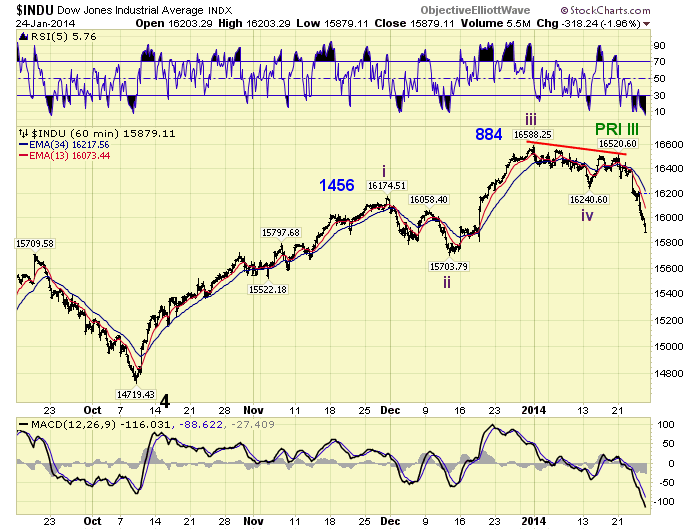
We continue to count this bull market as Cycle wave [1] of the next Super cycle bull market. Rising Cycle waves unfold in five Primary waves. Primary waves I and II completed in 2011, and Primary wave III has been underway since then. Primary I divided into five Major waves with a subdividing Major wave 1. Primary III has divided into five Major waves, but both Major 1 and Major 3 have subdivided. Recently we have been in a steady Major wave 5 since August in the SPX, and October in the DOW.
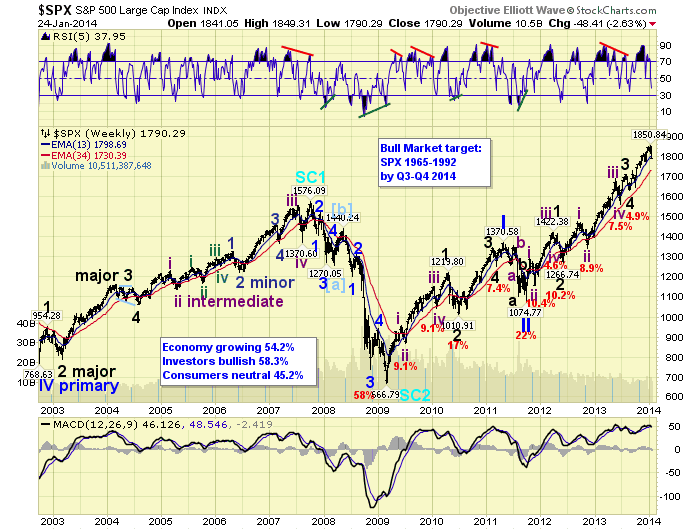
When Major wave 5 concludes, if it not already has, we should see the largest decline since 2012 for Primary wave IV. This type of correction should take the SPX near or below the Major wave 4 low at 1627, and/or the DOW’s Major 4 low at 14,719. After it concludes we should get a resumption of the bull market to all time new highs to conclude Primary V and Cycle wave [1]. We have been projecting this all to unfold by Q3/Q4 2014.
MEDIUM TERM: uptrend weakening
We have been tracking this Major wave 5 uptrend in the SPX since August, and the Major wave 5 uptrend in the DOW since October. The two counts have been slightly shifted in what we have called a trifurcation market: all four major indices moving to a different wave count.
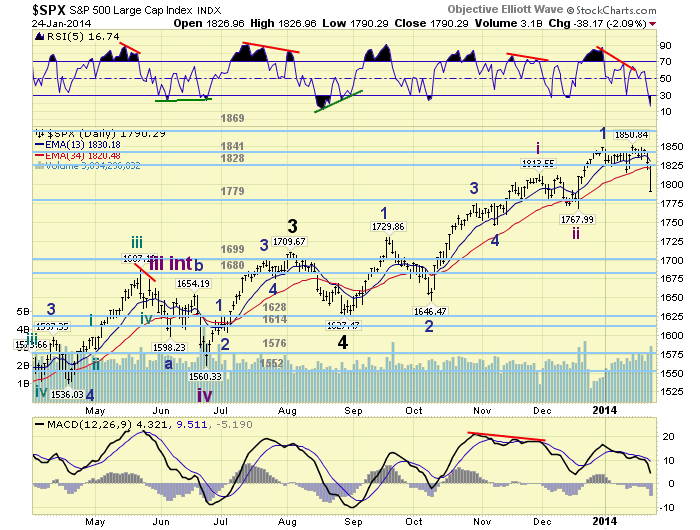
As of last weekend we had counted nine waves up in the SPX, but only three waves up in the DOW awaiting a higher high. We offered two potential alternate counts last week suggesting this uptrend could be coming to an end as soon as the DOW makes new highs. This week, when the DOW failed to make a higher high again, and then began to selloff, we remained with our original SPX count posted above.
After this week’s late selloff, and a serious weakening of the uptrend, we post that alternate count again. This count suggests Primary wave III could have ended at SPX 1851 after nine waves up, and with a fifth wave failure in the DOW.

Since the DOW did make new all time highs during Major wave 5 this would not be considered a fifth wave failure in the medium term. Which the SPX had once during this bull market. But a fifth wave failure on a short term basis, which has occurred at least once before. This bull market has had notoriously deceptive fifth waves.
In a review of the first daily SPX chart above, we observe a Minor wave 2 pullback of about 80% of the Minor 1 advance from the August low. Since we are still carrying this pullback as a Minor wave 2, the 1779 pivot range would represent a similar support level. A break below that range (1772-1786), and then a drop below SPX 1768, would suggest the Major wave 5 uptrend has ended and Primary wave IV has been underway. Similarly, if the DOW drops below 15,704 any time soon, that would almost assuredly confirm a downtrend in the DOW as well. Heading into next week keep an eye on these two levels: SPX 1768 and DOW 15,704. Medium term support is at the 1779 and 1699 pivots, with resistance at the 1828 and 1841 pivots.
SHORT TERM
Short term support is at the 1779 pivot and SPX 1768, with resistance at SPX 1800 and SPX 1814. Short term momentum ended the week extremely oversold. The short term OEW charts remain negative with the reversal level now SPX 1825.
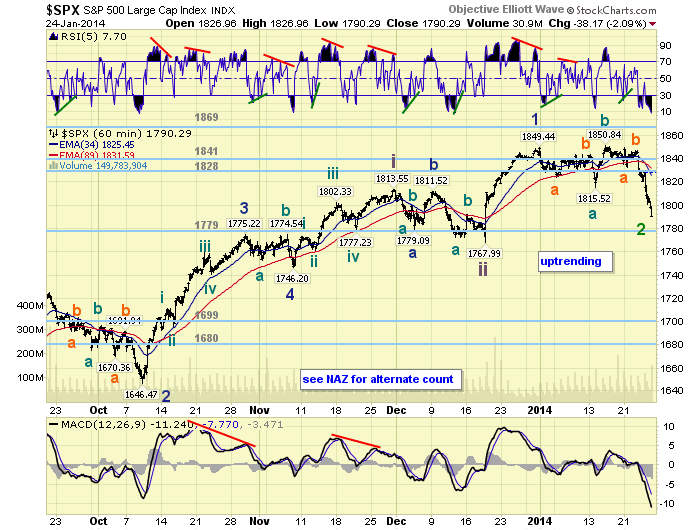
As noted above, a pullback to the OEW 1779 pivot would be an equivalent of the pullback during the previous Minor wave 2. However, for the past two days the market has acted somewhat lifeless. The rallies have been small and short lived, that have quickly been followed by lower lows. We have posted the main SPX count above, and the DOW alternate count below. The alternate counts posted in the medium term section are located at the very end of the public charts. Best to your trading what sets up to be a wild week ahead.
FOREIGN MARKETS
The Asian markets were mixed on the week for a net loss of 0.7%.
The European markets were all lower for a net loss of 4.2%.
The Commodity equity group were all lower for a net loss of 2.1%.
The DJ World index lost 2.3% on the week.
COMMODITIES
Bonds appear to be uptrending and gained 0.5% on the week. Rates are in a downtrend.
Crude is trying to confirm a new uptrend and gained 2.7% on the week.
Gold is uptrending and gained 0.9% on the week. Should equities continue to head lower Gold has an opportunity to move higher.
The USD appears to be heading into another downtrend losing 1.0% on the week.
NEXT WEEK
Monday: New home sales at 10am. Tuesday: Durable goods orders, Case-Shiller and Consumer confidence. Wednesday: the FOMC statement and Bernanke’s last meeting. Thursday: Q4 GDP (est. 3.0% to 3.5%), weekly Jobless claims, and Pending home sales. Friday: Personal income/spending, PCE prices, Chicago PMI and Consumer sentiment. The FED has nothing scheduled beside the two day meeting. Best to your weekend and week!
CHARTS: http://stockcharts.com/public/1269446/tenpp
http://caldaroew.spaces.live.com
After about 40 years of investing in the markets one learns that the markets are constantly changing, not only in price, but in what drives the markets. In the 1960s, the Nifty Fifty were the leaders of the stock market. In the 1970s, stock selection using Technical Analysis was important, as the market stayed with a trading range for the entire decade. In the 1980s, the market finally broke out of it doldrums, as the DOW broke through 1100 in 1982, and launched the greatest bull market on record.
Sharing is an important aspect of a life. Over 100 people have joined our group, from all walks of life, covering twenty three countries across the globe. It's been the most fun I have ever had in the market. Sharing uncommon knowledge, with investors. In hope of aiding them in finding their financial independence.
Copyright © 2014 Tony Caldaro - All Rights Reserved Disclaimer: The above is a matter of opinion provided for general information purposes only and is not intended as investment advice. Information and analysis above are derived from sources and utilising methods believed to be reliable, but we cannot accept responsibility for any losses you may incur as a result of this analysis. Individuals should consult with their personal financial advisors.
Tony Caldaro Archive |
© 2005-2022 http://www.MarketOracle.co.uk - The Market Oracle is a FREE Daily Financial Markets Analysis & Forecasting online publication.