


Gold Junior Miners... The Importance of Being Too Early
Commodities / Gold and Silver Stocks 2014 Jan 27, 2014 - 05:37 AM GMT

 There is a lot we could discuss in this Weekend Report from the price action in the US stock markets to the world stock markets. As we are almost fully invested in the precious metals complex, and especially the juniors at this time, I think we need to put aside all the outside noise and focus on our PM investments.
I know many of our subscribers follow other market other than the precious metals sector which is good. There are thousands of investment opportunities out there that can be a daunting task trying to figure out where to invest ones hard earned capital. I'm agnostic when it comes to making money in the markets. I don't care which area to invest in as long as there is some volatility either going up or down. The 1990's was a good time to invest in the tech stocks for example.
The precious metals complex fits the bill for me over the last 12 years as there is plenty of volatility going up and coming down especially with some of the precious metals stocks. Over the last 12 years there have been four separate occasions when my portfolios have done over 400% and that was mostly on the long side. I was lucky enough to catch the 2008 crash using SMN and DUG because there wasn't any leveraged short gold miners etf's like we have today. I was also lucky enough to catch the bulk of this bear market in the precious metals complex when we took our first short position in December of 2012 and exited in the first week of August of 2013. Now here we are sitting at another potential crosswords in the precious metals arena again.
One thing I've learned playing this sector and especially the juniors is that if you want to make the big bucks you have to get in early, right or wrong. I have taken several positions that didn't stick and was stopped out even, or with a slight loss, but if you are early enough and right the doubling affect on the juniors can be astounding. Most of you already know this but let me just give you a theoretical example at what this means. If for instance you buy a junior for .10 cents you double your money when it gets to .20 and if it gets to $1.00 you have a 10 bagger or 10 times your original investment. On the other hand if you waited until the price got to .20 before you bought and it goes to $1.00 you only make half as much money. But the real story is when you get a junior, using the same example, the double affect really starts to kick in the higher the stock goes. The compounding affect can be tremendous if you buy the right stock. That's one reason I like to buy a basket of juniors because you only need one or two to really hit pay dirt.
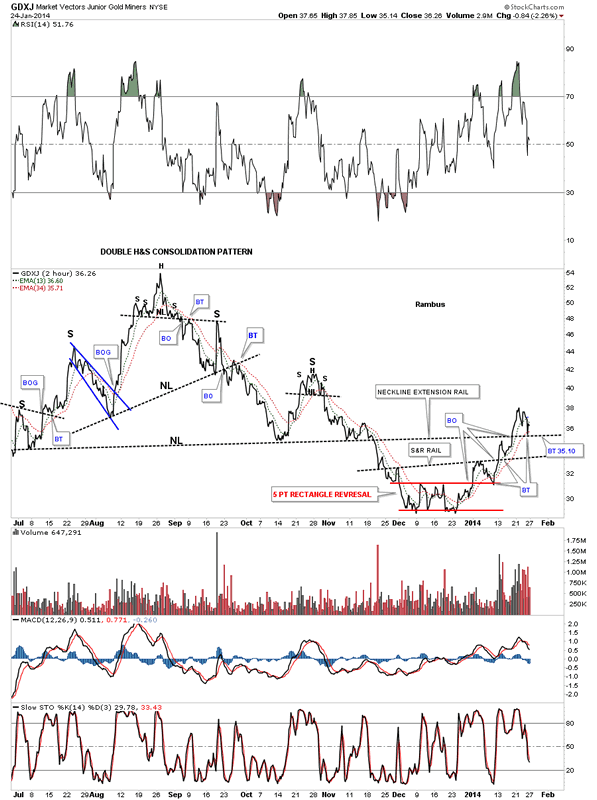
Lets look at the GDXJ junior gold miners index that is still in the beginning stages of a new uptrend. The early part of a new uptrends can be fragile but as long as nothing is broken you have to give them the benefit of a doubt. So far the new uptrend has been picture perfect. We have the red 5 point rectangle reversal pattern that reversed the downtrend. Note how each trendline, starting with the breakout from the red rectangle, to the first up slopping black dashed line to the neckline extension rail all had a clean breakout and a clean backtest. You can see where Friday's weakness found support, right on the neckline extension rail at 35.10. So far this is the price action working to take out overhead resistance. This type of price action is telling us the bulls are gaining in strength as each backtest is being bought. This is reality right now which is all we have to work with. Can something changes the reality, yes but until it does it is what it is.
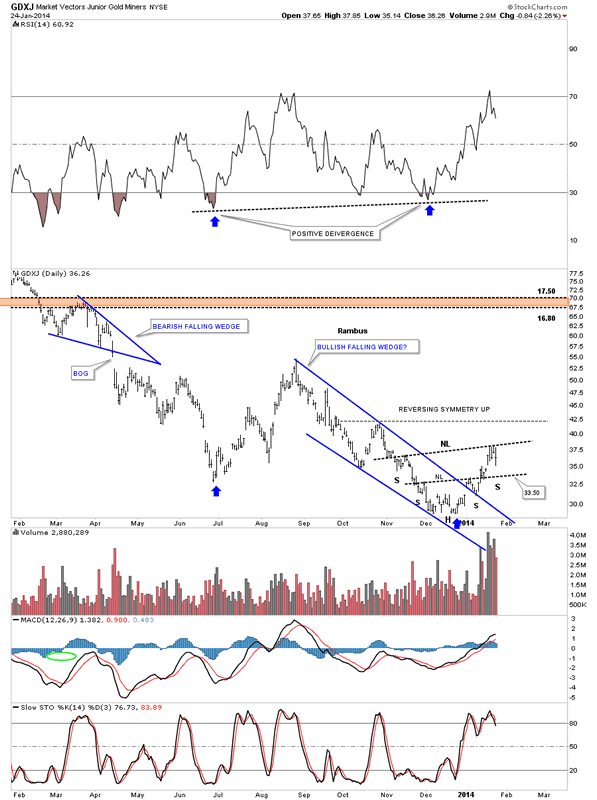
This next chart for the GDXJ shows us some more positive price action. As you can see there was a nice clean breakout from the blue bullish falling wedge and had a backtest 5 days later to the top blue rail. There is another piece of Chartology that is at work right now and that is how the price action is reversing symmetry back up as shown by the two small inverse H&S bottoms. What happened on the way down is now happening in reverse to the upside when you look at the previous small tops on the way down. It would be painful but there could be a backtest to the lower neckline at 33.50 before price move higher. No guarantee though. Note the positive divergence on the RSI at the top of the chart, blue arrows.
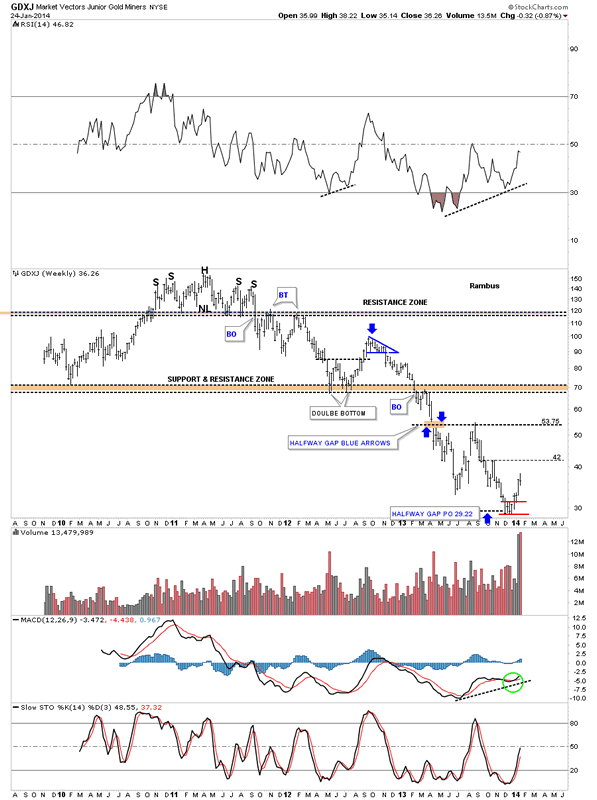
The weekly chart below shows the whole price history for the GDXJ. First, notice how the brown shaded support and resistance zone worked as support and then when they were broken to the downside they reversed their role and acted as resistance. That is Chartology 101. The next thing I would like to show you on this weekly chart is the halfway gap that was formed last spring when prices really started to fall which created the gap. The blue arrows shows how I measured the halfway gap which had a price objective down to the 29.22 area almost exactly the very bottom. I think this is an important clue that that impulse leg down ran out of gas at right where it should have. There is also a positive divergence on this weekly chart for the RSI.
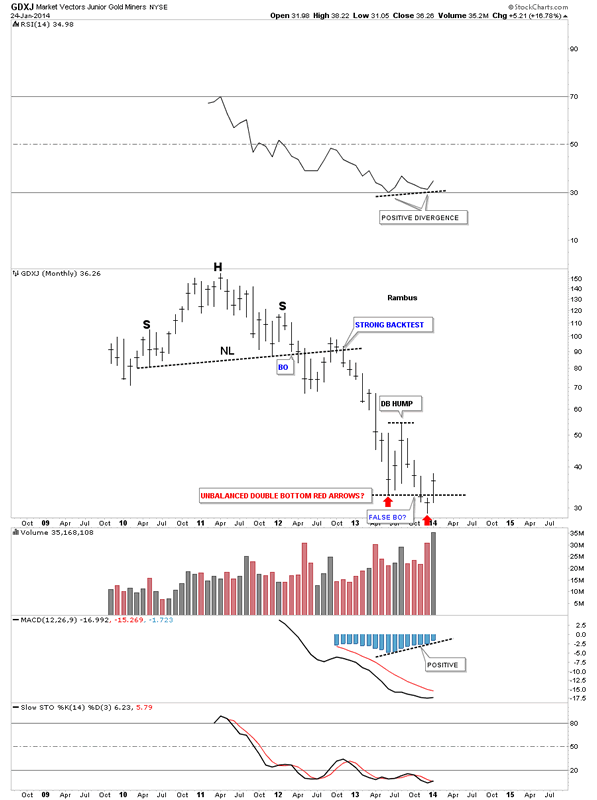
Lets take a look at the long term monthly chart that shows the big H&S top that all the precious metals stock indexes had. It had a good breakout but the backtest was a little strong but that didn't change the overall bearish picture as that's when the price action really began to tumble. You can see the first low that was made in June of last year and the bounce that occurred. Then the December low fell below the Junes low which was very negative at the time. Many times these false break outs represents the final capitulation and the last bear has finally sold out creating a vacuum of only buyers so you get an important bottom. We still have one more week of trading in January but you can see this month produced the first black volume bar in a long time. One last point on this chart and this goes for the rest of the precious metals stock indexes. At this point in time the only pattern I can put to the price action between June and December of last year is an unbalanced double bottom. With the price action rallying above the June and December lows that's the only pattern that fits the bill. This potential double bottom may morph into something else later but we don't have the luxury of hindsight. Many times after a stocks has a big decline or rally you will see a variation of a double top. Some are neat and clean while others are unbalanced. We won't know the answer to that question until the double bottom hump is broken to the upside.
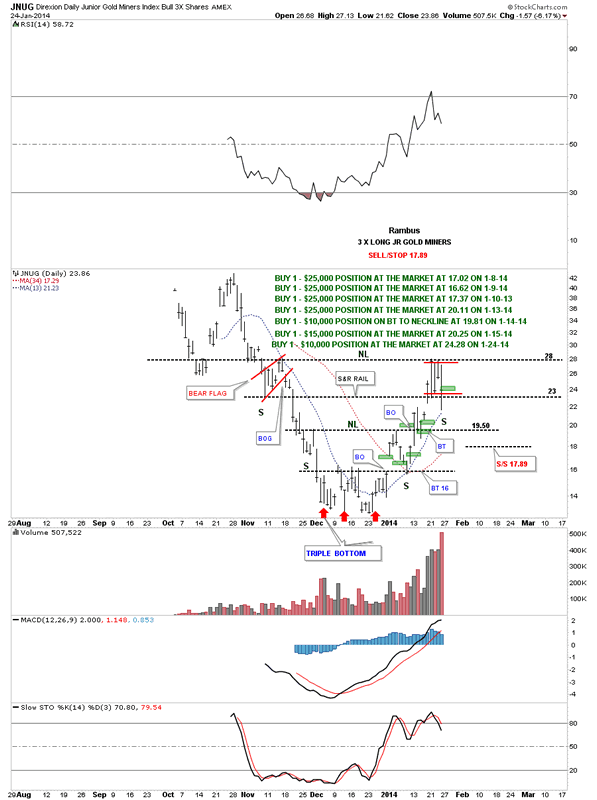
Lets now look at the JNUG that is the trading instrument we are using to trade the juniors for the most part. The first chart is the one I've shown you that has all our buy points labeled with the green rectangles. Just follow the price action up from the red arrow on the right side of the bottom pattern. You can see how each buy was made based on the breakout and then the backtest. As you can see we took our last position last Friday which would be the top green rectangle on the backtest to the S&R rail. You can see the reverse symmetry taking place. How it went down is how it's coming back up. The backtest was a little strong on Friday but nothing was broken. Also notice that if this backtest can hold right here on the S&R rail and JNUG can then rally up strongly through the top black dashed horizontal rail, that I've labeled as a possible neckline #2, then JNUG will be forming a much bigger inverse H&S bottom. This is only a possibility at this point but it's something I'm watching very closely.
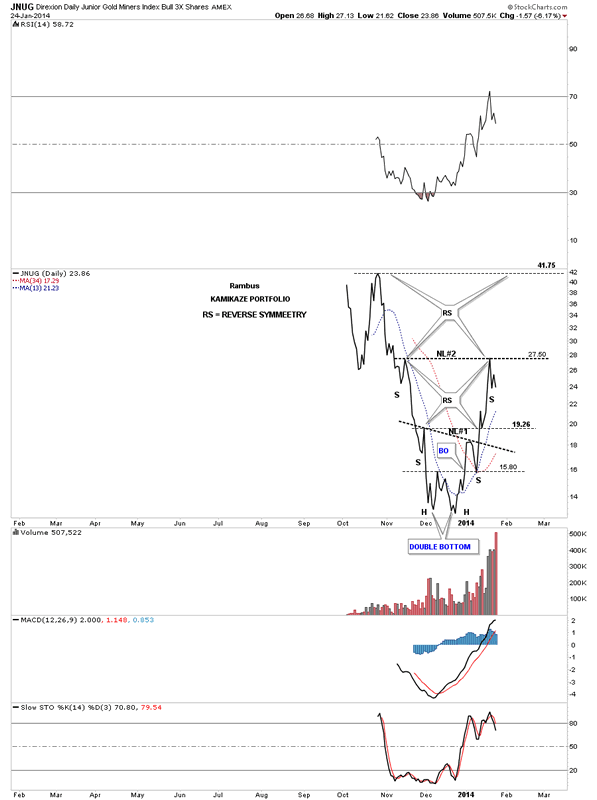
Lets look at one last chart that is a daily line chart for JUNG. This chart shows you a very clear picture of the reverse symmetry that is taking place since the little double bottom was put in back in December of last year which created the head portion of the inverse H&S bottom #1. Note how the lower right shoulder was formed on the backtest to the double bottom hump at 15.80. JNUG then rallied all the way up to the next high at 27.50 which acted as resistance late last week and we are now getting a move lower that could form a right shoulder. That's the million dollar question right now. If JNUG can find a low somewhere in this general area and then rally backup through neckline #2 that would create a very large inverse H&S bottom which would equate to much higher prices. First things first though. In order for this setup to work JNUG needs to find a bottom very soon right in here. So far nothing is broken that would tell me to abort this potential bullish setup. So we have to go with the odds until something changes.
So this is where we stand in regards to our largest position. As you well know the markets can change in a heartbeat but we have to go with the odds that is suggesting to stay the course for now until something changes the scenario I've laid out for you. All the best...Rambus
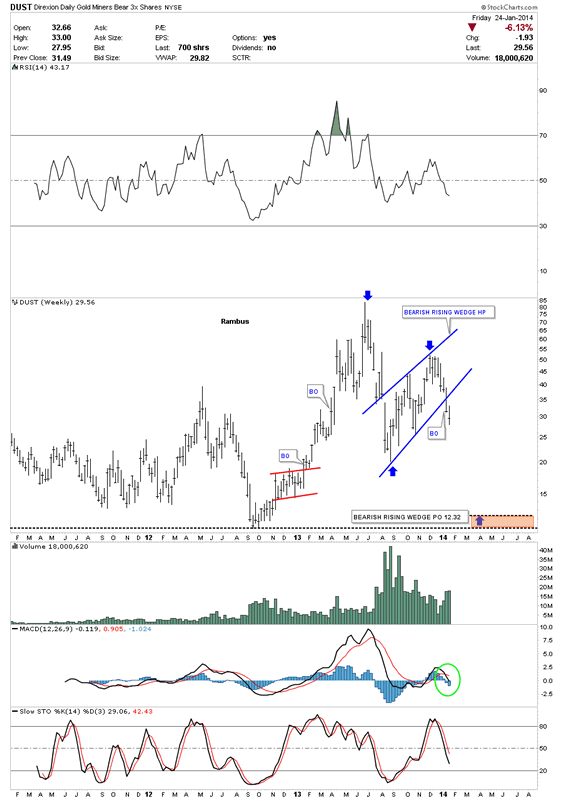
PS: Here is a daily chart for DUST which is a 3 X short the gold miners etf that we used during the bear market last year. It looks like it may have just broken down out of a blue bearish rising wedge halfway pattern. If that is the case then this means the precious metals stocks will be in rally mode as DUST is declining. This looks like it's going to be an interesting week to say the least.
All the best
Gary (for Rambus Chartology)
FREE TRIAL - http://rambus1.com/?page_id=10
© 2014 Copyright Rambus- All Rights Reserved
Disclaimer: The above is a matter of opinion provided for general information purposes only and is not intended as investment advice. Information and analysis above are derived from sources and utilising methods believed to be reliable, but we cannot accept responsibility for any losses you may incur as a result of this analysis. Individuals should consult with their personal financial advisors.
© 2005-2022 http://www.MarketOracle.co.uk - The Market Oracle is a FREE Daily Financial Markets Analysis & Forecasting online publication.