


U.S. Dollar Remains Mixed
Currencies / US Dollar Feb 17, 2014 - 05:49 PM GMTBy: Nadia_Simmons

 The U.S. currency was little changed near recent lows against major currencies as U.S. markets are shut for the President’s Day holiday and trade volumes remain thin. Nevertheless, it’s worth noting that the greenback declined to a four-year low against the British pound earlier today. What is the current outlook for major currency pairs? We invite you to read our today's Forex Trading Alert.
In our opinion the following forex trading positions are justified - summary:
- EUR/USD: none
- GBP/USD: none
- USD/JPY: none
- USD/CAD: none
- USD/CHF: none
- AUD/USD: none
EUR/USD
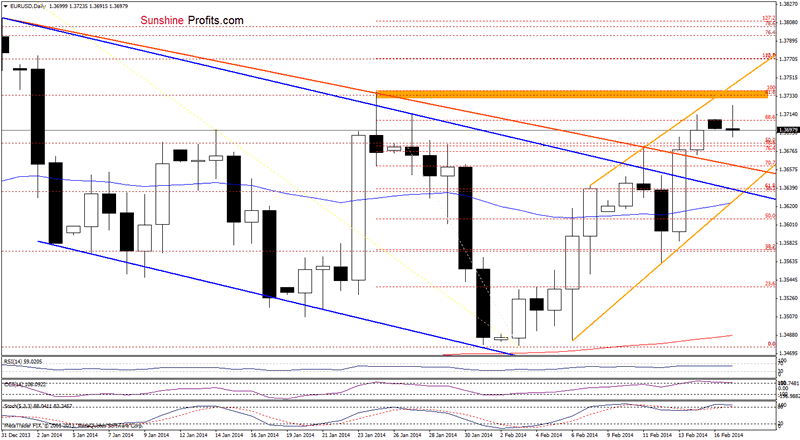
Looking at the above chart, we see that the situation has improved slightly earlier today as EUR/USD extended gains and approached the Jan.24 high (and also the 61.8% Fibonacci retracement based on the entire Dec.-Feb. decline). As you see on the daily chart, this resistance zone is reinforced by the upper line of the rising trend channel (marked with orange). Taking this fact into account, and combining with the current position of the indicators, it seems that a correction is just around the corner.
Very short-term outlook: bullish
Short-term outlook: mixed
MT outlook: mixed
LT outlook: bearish
Trading position (short-term): In our opinion no positions are justified from the risk/reward perspective at the moment. However, if the exchange rate invalidates breakouts above the orange declining line and the upper line of the declining trend channel, we will likely consider opening short positions.
GBP/USD
Quoting our last Forex Trading Alert:
(…) GBP/USD extended gains and (…) broke above the upper border of the rising wedge, which is a strong bullish signal. However, the space for further growth seems limited- especially when we factor in the proximity to the orange resistance line and the current position of the indicators (the RSI reached the level of 70 and two other indicators are overbought). Taking this facts into account, it seems that a pause or a pullback is just around the corner.
As you see on the above chart, GBP/USD moved higher once again and even broke above the medium-term orange resistance line. However, this improvement was only temporarily and the pair slipped below this major resistance line earlier today. Despite this drop, the exchange rate still remains above the previous high and well above the upper border of the rising wedge, which supports buyers. However, if the pair invalidates the breakout and drops below the lower border of the rising wedge, we will likely see further deterioration.
Very short-term outlook: bullish
Short-term outlook: mixed with bullish bias
MT outlook: mixed
LT outlook: mixed
Trading position (short-term): In our opinion no positions are justified from the risk/reward perspective. Nevertheless, if the pair declines below the lower border of the rising wedge, we will consider opening short positions.
USD/JPY
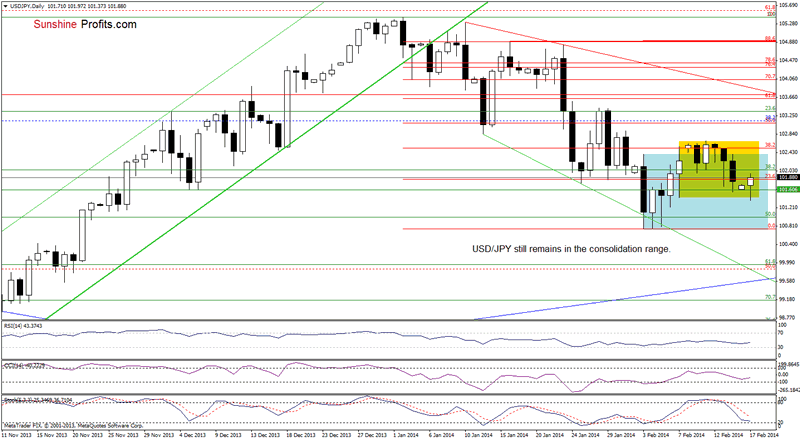
Although the situation has deteriorated earlier today as USD/JPY extended declines and slipped below last Friday low, the pair rebounded and still remains in a narrow range (marked with yellow). On one hand, we may see further improvement and an upswing to the upper border of the consolidation range. On the other hand, when we take a closer look at the position of the indicators, we see that they still support sellers. So, another attempt to move lower should not surprise us.
Very short-term outlook: mixed
Short-term outlook: mixed with bearish bias
MT outlook: bullish
LT outlook: bearish
Trading position (short-term): In our opinion, the situation is too unclear to go short or long at the moment. So, in our opinion no positions are justified from the risk/reward perspective.
USD/CAD
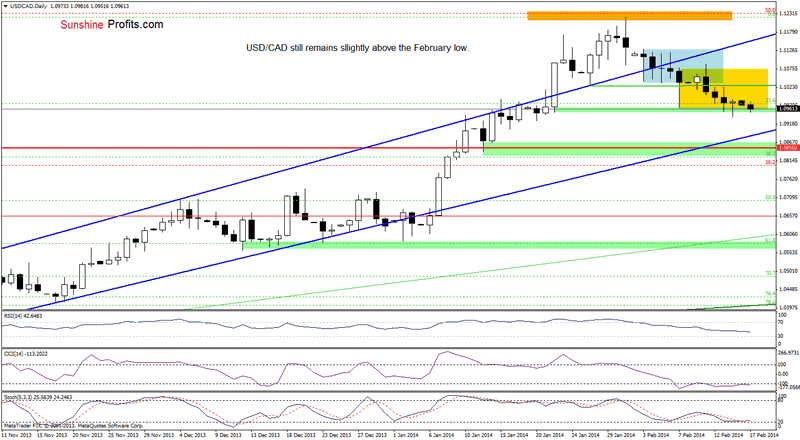
Looking at the above chart, we see that the situation hasn’t changed much as USD/CAD remains in a narrow range slightly above the Jan.22 low. Therefore, what we wrote in our last Forex Trading Alert remains up-to-date also today.
(…) at this point, we should consider two scenarios. If this support level encourages buyers to act, we will likely see another comeback to the consolidation range (marked with blue). However, if it is broken and the exchange rate closes the day below the Jan.22 low, it will likely trigger a decline to 1.0904 (the Jan. 16 low) or even to a strong support zone created by the 38.2% Fibonacci retracement level (based on the entire Sept.-Jan. rally), the lower border of the trend channel, the Jan. 13 low and the 2010 high.
Very short-term outlook: mixed
Short-term outlook: mixed
MT outlook: bullish
LT outlook: bearish
Trading position (short-term): From today’s point of view, even if the pair extended losses, the lower border of the trend channel will likely stop further deterioration. Therefore, in our opinion opening short positions is not justified from the risk/reward perspective.
USD/CHF
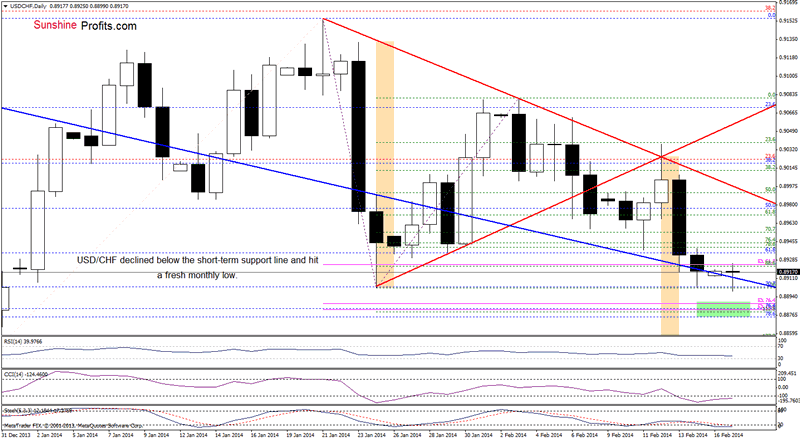
Looking at the above chart, we see that USD/CHF extended declines and dropped below the January low once again. However, similarly to what we saw on Friday, this support level encouraged buyers to act and the pair rebounded. With this upswing, the exchange rate came back above the short-term declining support line (marked with blue), which is a positive signal (especially when we factor in a positive divergence between the CCI and the exchange rate). Nevertheless, we should still keep in mind what we wrote in our last Forex Trading Alert:
(…) a drop below the lower border of the triangle may trigger further deterioration and the downside target for the pattern would be around the December low (…) if the short-term declining support line is successfully broken, we will likely see a drop (…) even to a support zone created by the 76.4%, 78.6% Fibonacci retracement levels (based on the Dec.-Jan. rally) and the 76.4%, 78.6% Fibonacci projections (marked with a green rectangle on the above chart).
Very short-term outlook: bearish
Short-term outlook: mixed
MT outlook: bearish
LT outlook: bearish
Trading position (short-term): Even if the pair drops below the January low once again, the space for further declines seems limited. Therefore, in our opinion opening short positions after such drop is not a good idea from the risk/reward perspective.
AUD/USD
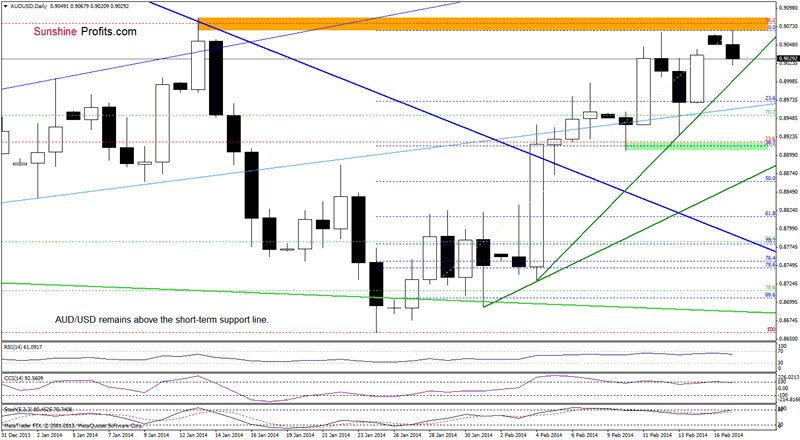
As you see on the above chart, AUD/USD extended gains and hit a fresh monthly high earlier today. Despite this increase, the pair still remains below the 38.2% Fibonacci retracement level, which serves as major resistance at the moment. From today’s point of view, we see that the current correction is similar to the previous one, which means that the very short-term uptrend is not threatened at the moment. Nevertheless, the current position of the indicators suggests that a bigger pullback is just around the corner.
Very short-term outlook: mixed
Short-term outlook: mixed with bullish bias
MT outlook: bearish
LT outlook: bearish
Trading position (short-term): In our opinion, if the pair drops below the February 10 low, we might consider opening short positions. However, as long as AUD/USD remains between above this level and the 38.2% Fibonacci retracement level, in our opinion no positions are justified from the risk/reward perspective.
Thank you.
Nadia Simmons
Sunshine Profits‘ Contributing Author
Oil Investment Updates
Oil Trading Alerts
* * * * *
Disclaimer
All essays, research and information found above represent analyses and opinions of Nadia Simmons and Sunshine Profits' associates only. As such, it may prove wrong and be a subject to change without notice. Opinions and analyses were based on data available to authors of respective essays at the time of writing. Although the information provided above is based on careful research and sources that are believed to be accurate, Nadia Simmons and his associates do not guarantee the accuracy or thoroughness of the data or information reported. The opinions published above are neither an offer nor a recommendation to purchase or sell any securities. Nadia Simmons is not a Registered Securities Advisor. By reading Nadia Simmons’ reports you fully agree that he will not be held responsible or liable for any decisions you make regarding any information provided in these reports. Investing, trading and speculation in any financial markets may involve high risk of loss. Nadia Simmons, Sunshine Profits' employees and affiliates as well as members of their families may have a short or long position in any securities, including those mentioned in any of the reports or essays, and may make additional purchases and/or sales of those securities without notice.
© 2005-2022 http://www.MarketOracle.co.uk - The Market Oracle is a FREE Daily Financial Markets Analysis & Forecasting online publication.