


Gold and Silver Bull Market Chart Bonanza!
Commodities / Gold & Silver Apr 23, 2008 - 04:14 PM GMTBy: Jordan_Roy_Byrne

 In today's chart update I'm going to review the precious metals sector. First I would like to debunk some of the reasons given why the bull run in precious metals is over.
1) The Fed will be done cutting rates.
The Fed has to continue to cut rates so that banks can borrow short and lend long (profitably). The Fed Funds rate is 2.25%. As I pen this, the 5-year US Treasury yield is 2.97%, while the yield on the 10-year is 3.74%. The Fed tends to follow the 3 Month T Bill, which is yielding 1.34%. Even if the Fed cut rates to 1%, banks would only make a few percentage points on their loans. That doesn't even beat the “core rate” of inflation. Even if the Fed stopped at 1%, would it immediately raise rates thereafter? No. Would it be bearish for precious metals if the Fed held rates at 1% or 2% for a while? Hardly. Fed policy is not going to be bearish in regards to precious metals anytime soon. More on this later.
2) A recession means lower demand and consumption, which in turn pushes down inflation.
This is a lazy argument and it's a shame that many of the well educated subscribe to this. The correct point is that price inflation is more likely to worsen in a weak economy. Prices essentially equal money supply divided by production. In a recession or weak economy production does not grow. For price inflation to decline in a weak economic environment production has to fall less than money supply growth. We are in a recession and the broad money supply measured by the folks at nowandfutures.com is skyrocketing (now growing at an annualized rate of 20%). Negative growth coupled with an increasing money supply (20% annualized) is going to give us much higher prices.
3) Precious Metals are in a bubble.
For a market to be in a bubble, investments have to be extremely concentrated in the bubble sector. Remember in the tech bubble when so many investors had 50%, 60% or 70% of their assets in tech? The bull market becomes a bubble when its size begins to dwarf other markets. Precious metals have surely risen quite a bit, but have they experienced the same rise against other markets?
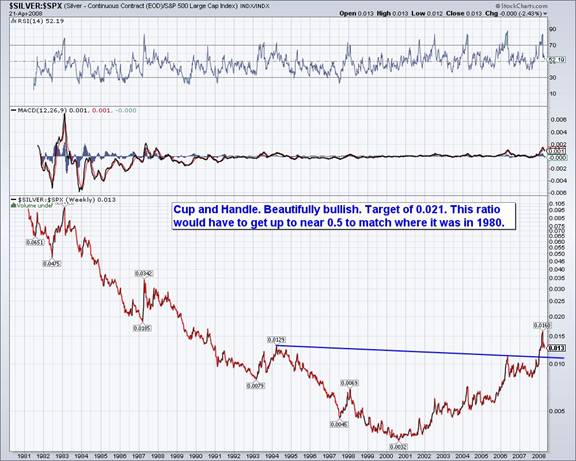
First let's take a look at Silver vs. the S&P 500:
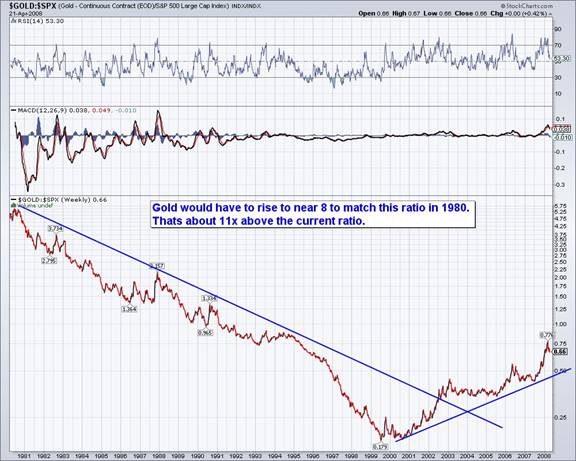
Next here is Gold vs. the S&P 500:
Next up we have the XAU Gold Stock index graphed against the S&P 500:
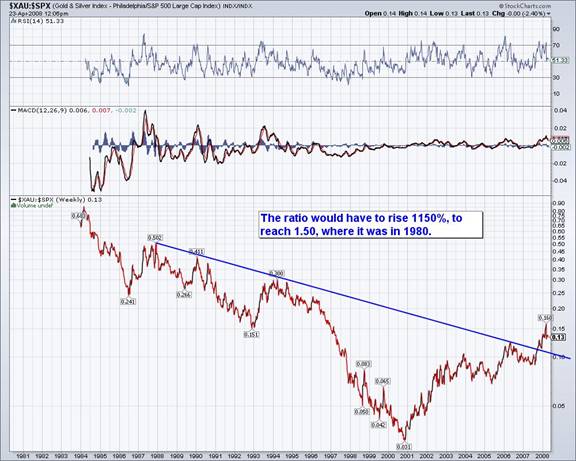
Oh yeah. Look at that huge bubble in the precious metals…..NOT!
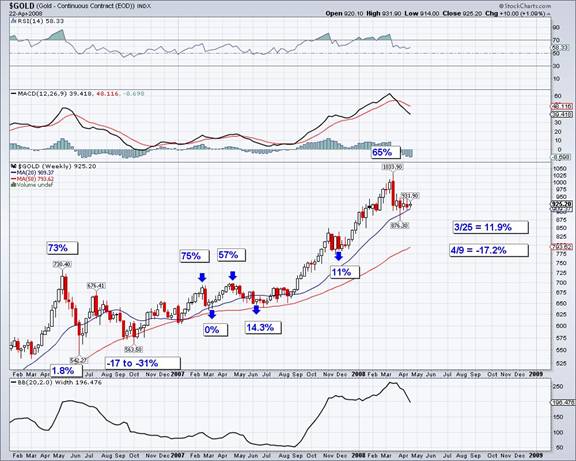
The reality is that since August of last year, the shift from paper assets into hard assets has begun to accelerate. As these charts show, gold and gold shares have a long way to run. Now Let's take a look at just gold by itself. Below is a long-term daily chart followed by my analysis.
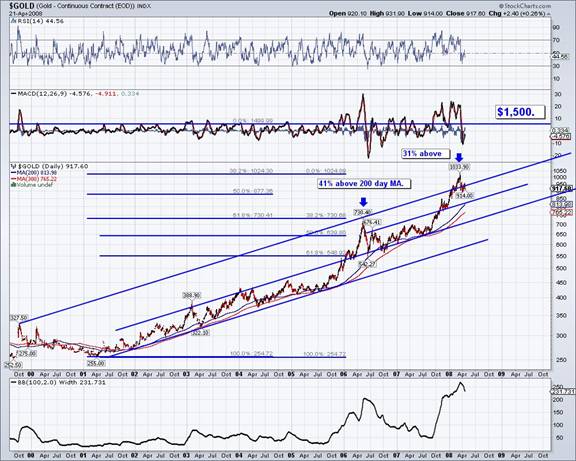
Gold at its recent peak was not as extended as it was in May of 2006. As you can see, gold was 31% above its 200-day moving average, compared to 41% in 2006. Also, in 2006 Gold broke through and held above the channel that contained its price for the previous five years. The recent run in gold was not quite enough for the metal to hold above the entire bull market channel.
Where might gold find support? The 50% retracement of the recent move from $640 to $1034, is $837. $850, being the 1980 peak and the peak in October 2007, is another consideration. Take a look at the second highest trendline; the one that begins in mid 2006 and supported the correction in late 2007. I zoomed in on this (before posting) and its current support is $815. At the end of July it is $850 and then $865 in October. To summarize, I see a major confluence of support early this summer from $837 to $850.
Next, let's take a look at Silver:
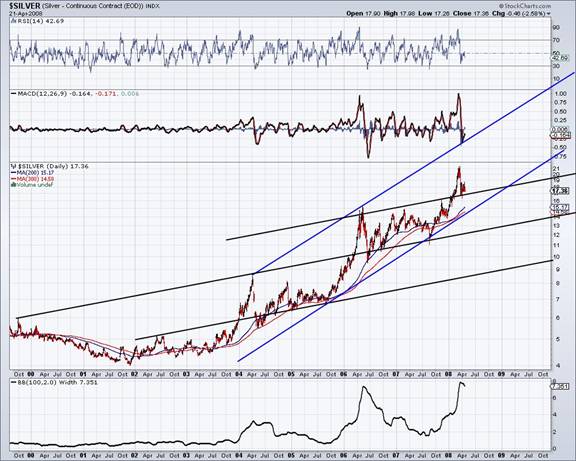
Like gold, silver is in better position than it was at its May 2006 peak. Silver has major support at $15. It was an important peak and it took silver four tries to best it. Also the 200-day moving average is at $15.17 and rising. I should also note that the corrections that followed silver's big moves in 2004 and 2006, corrected more than 62% of the advance. The 62% retracement of silver's recent move is $15 exactly. So silver is going to hold up much better than it did following the previous two spikes. Any dip below $16.50 and silver is a great buy.
Looking ahead, $25 is the next magnet for silver. $25 was the peak prior to the spike to $50. Also, if you look at a very long term chart of silver you will notice an obvious cup and handle originating from $15 in 1983 down to $4 in the early 1990s and 2000s and back up to $15 in 2006-2007. The recent breakout gives us a target of $26 (15-4 = 11. 11 +15 = 26). Okay, so it isn't $25 but you get the point. $25/$26 is the next target.
Next up let's take a look at Silver vs. Gold:
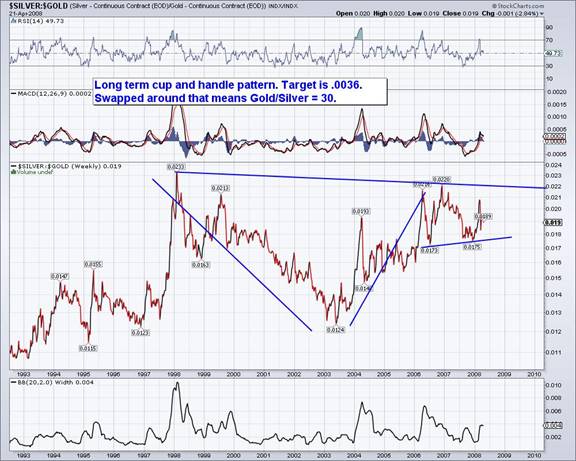
The Silver/Gold chart has formed a very nice cup and handle pattern. It looks to me like the handle, which has been forming since 2006 will soon finish. Those who follow technical analysis know how reliable the cup and handle pattern is. The inverse of the breakout target is a Gold/Silver ratio of 30. Perhaps that means a gold price of $1,500 and silver price of $50.
In the past year the metals have been a better bet than the shares. Is that going to change soon? Let's take a look at some charts that may help us glean an answer. First, I'm showing a HUI/Gold chart and on the bottom we have the 3-month T-Bill yield and one yield curve. My analysis is below.
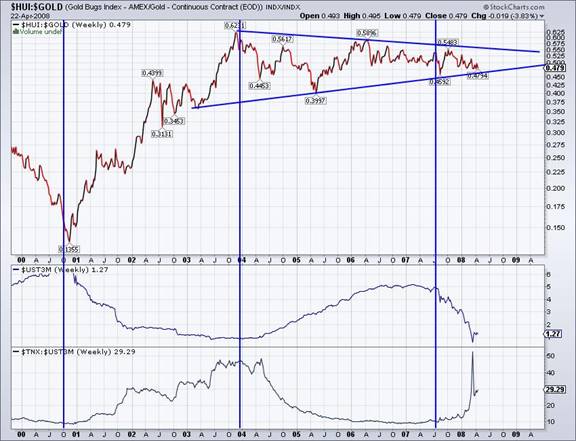
The relative performance of gold stocks (in this bull market) was best when short-term rates were falling and when the yield curve was rising. It wasn't until short-term rates began to rise (and the yield curve started to flatten) that relative performance of gold stocks fizzled. The Fed took rates down from 6.50% in mid 2000 to 1.75% by the end of 2001. It took another two years for the Fed to cut to 1%. The Fed didn't begin to raise rates until mid 2004. So while most of the Fed's work was completed by 2002, most of the gain and relative gain in gold shares occurred thereafter.
Looking at the short term, the shares are starting to show some strength against gold.
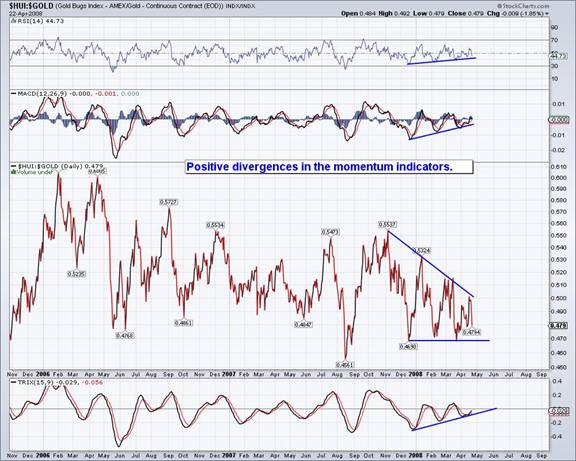
Since November, the HUI/Gold ratio has been in a grinding downtrend while the all three momentum indicators have made a series of higher lows. Keep an eye on the ratio to see if it makes a new low along with gold.
Next up, we take a look at the Canadian Venture Composite Index, which contains small and microcap companies. It is the best available public index for tracking the junior mining sector. Our analysis follows the chart.
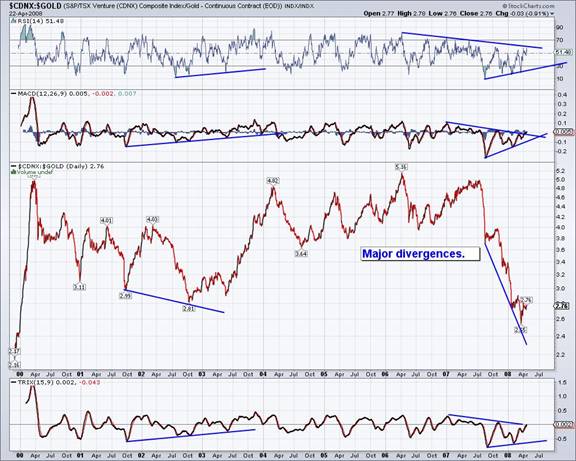
Since July 2007 the relative performance of the index collapsed more than 50% against the price of gold. The index against gold is now at its lowest point since the bull market in gold and commodities began. However we see positive and strengthening momentum divergences. Going forward, the CDNX should rebound and outperform gold.
Next up we have a chart of the HUI vs. CDNX. This is a ratio of small and micro cap miners against large unhedged gold companies.
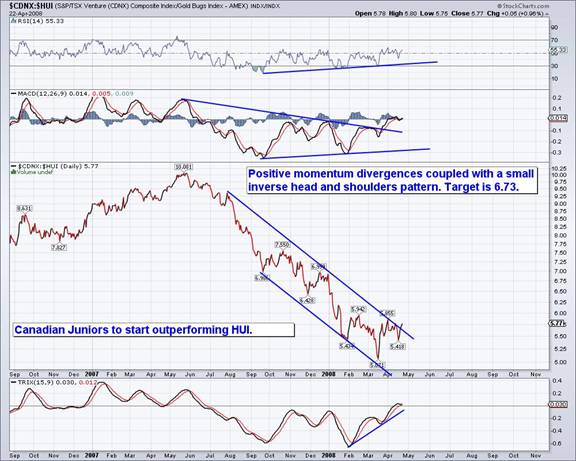
If the gold stocks have been beaten down then small and microcap miners have been outright murdered. However, things are turning in favor the little guys. In the above chart the CDNX/HUI ratio is showing a small inverse head and shoulders pattern along with some very strong momentum divergences. Going forward, the small and microcap miners should outperform their larger counterparts.
Sentiment
Some of you know of Mark Hulbert who tracks the performance of many newsletters. He also tracks the gold market timers and developed a sentiment indicator based on the views of those gold timers. It is called the Hulbert Gold Stock Newsletter Indicator (HGSNI). Here is his latest update.
The HGSNI has ranged from -31% to 89%. The percent is the average of the gold timers suggested gold portfolio exposure to gold. 89% means that 89% of your gold portfolio should be long, while -31% means that 31% of your gold portfolio should be short the market. From a contrarian perspective, a lower number is bullish, while a higher number bearish. I looked through his archives and in my next chart, annotated the HGSNI at key turning points.
I want to quickly note that I couldn't find the exact figure for the October 2006 bottom but based on Hulbert's information, it lies in the specified range. This sentiment analysis supports the view that the recent top was not as extended as the one in May 2006. Gold timers were less bullish in March than they were in May 2006. Particularly striking is the fact that while gold has declined about 10% from the March peak, the HGNSI, as of two weeks ago, declined to -17%. Gold was trading at about $920 at that point.
It is important to remember a few things. First, corrections always have three legs. There is the first leg down, then a recovery and then the final leg down. So it is unlikely that the current correction is complete. Secondly, gauging sentiment is an art form. It is not an exact science. There are many different ways to analyze sentiment, and the HGNSI isn't the be all or know all. Nevertheless, it has a good record as a contrary indicator. The most recent HGNSI of -17% is an important indication that, despite a roaring gold market, sentiment is quite less bullish than you'd expect. If gold declines further, sentiment from a contrary viewpoint is likely to become more favorable to the bulls.
Conclusions
• Looking for Gold to bottom at $840 from late May to mid June. $790 to $800 is a realistic worst-case scenario.
• Sentiment, from a contrary perspective is in better shape today than it was following the peak in May 2006.
• Gold shares will bottom before the metals and lead back up
• Small and Microcaps (Juniors) will lead the HUI, XAU & GDX
• Silver will strongly outperform Gold
For more analysis on gold and silver stocks, you can visit my website where you can purchase a new report on 68 gold and silver stocks.
By Jordan Roy-Byrne
trendsman@trendsman.com
Editor of Trendsman Newsletter
http://trendsman.com
Trendsman” is an affiliate member of the Market Technicians Association (MTA) and is enrolled in their CMT Program, which certifies professionals in the field of technical analysis. He will be taking the final exam in Spring 07. Trendsman focuses on technical analysis but analyzes fundamentals and investor psychology in tandem with the charts. He credits his success to an immense love of the markets and an insatiable thirst for knowledge and profits.
Jordan Roy-Byrne Archive |
© 2005-2022 http://www.MarketOracle.co.uk - The Market Oracle is a FREE Daily Financial Markets Analysis & Forecasting online publication.