U.S. Dollar, Major Forex Market Forecasts for 2014 and 2015
Currencies / US Dollar Feb 18, 2014 - 10:18 AM GMTBy: David_Petch
 It has been awhile since I have posted on the web and thought this was an appropriate article to share. This article focuses on technical analysis of 3 currencies and the US Dollar Index. A lot of the technical indicators I follow are universal, but the way in which they are modified and put together will not be found anywhere else. Developing the Contracting Fibonacci Spiral and the inverse chiral inversion that happened last summer have played a role in the forecast of this article. As unbelievable as the forecast may seem by time the end of this article, there is a significant amount of logic that went into this and may even defy logic. There is a mathematical basis to this pattern and hopefully it will be understood somewhat by the end of this article...
The US Dollar Index has changed its pattern and has confirmed a number of trends discussed over the past few months. I have spent a lot of time reviewing the US Dollar Index this weekend, due to it remaining under pressure and failing to break higher. The Elliott Wave pattern I was following had the longer term pattern fail due to not breaking higher...This has repercussions for everything.
For one, gold and silver are likely to remain in an uptrend for longer than anyone may think...the last update I stated suggested 2-3 months...this could extend into next year, depending upon how the downtrend of the US Dollar Index progresses. The HUI/Gold Ratio is in an uptrend, so holding or adding to precious metal positions is still in effect.
Oil is again over $100/barrel and if it closes above $101/barrel, then it is going to $111 within 6-8 weeks, followed by a move to $130-140/barrel within 8-12 months. Once oil closes above $101/barrel on a daily basis, oil is locked into an uptrend, which will drive energy stocks higher. Conservative investors should look to enter positions once this trigger becomes activated.
Also, I have been thinking more about what the Chiral Inversion of the Contracting Fibonacci Spiral and what that means. From everything what I can fathom at this point in time, things are going to really move higher between now and Q2-Q3 2015. The CFS had a series of higher lows from 1932 until 2013, which had a series of higher lows. The chiral inversion of the CFS that happened last summer implied a reversal to this trend. A cycle low is expected sometime between Q2-Q3 2016 and suggests a series of lower highs from 2016 until 2020. The following time points are required to complete the CFS sequence after 2016: 2, 1 and 1. Two years after 2016 is 2018, which is the next expected cycle low, followed by 2019 and 2020. The 2020 low should mirror of the amount of time taken for the 2019 leg. As we reach the point of singularity in 2020, the volatility of the cycle will only increase.
So, going short at the right point in time during 2015 will be critical, because between now and then, many people are going to get burned and will not even want to try shorting anything again. At the 2016 bottom there should be a very powerful rally that lasts into 2017/early 2018, followed by another crash into mid to late 2018. Knowing the information above is going to be very critical, because a lot of money will either be made, or lost during this period of time.
I have a lot of updates to do this week to get back on track after spending too much time on this side analysis and thought process for how things unfold, but viewed this as a more important step. It is important to anticipate the hypothesis and continue to alter it and make the required changes to fit the model as time progresses. This is what Science is about...forming thoughts around a number of observations and extrapolating the thought into abstract form to model future experimentation. In our case, the field testing of our hypothesis is the market and because time only travels in one direction, we can not repeat the experiment. We can look back at history, but alas, it too only has one path.
One final thought...if the US Dollar Index is going to go down, then commodities are going to rise, which should in turn raise the value of the Canadian and Australian currencies going forward. It appears that Q2-Q3 2015 is going to represent the cycle low for the US Dollar, which should rise during the deflationary bought expected after this point in time.
Based upon this analysis, a list of gold and silver stocks to consider will be posted this week. Hint...most of these are one's that I have covered in the past, but a few new one's will be discussed over the coming week's.
Currencies
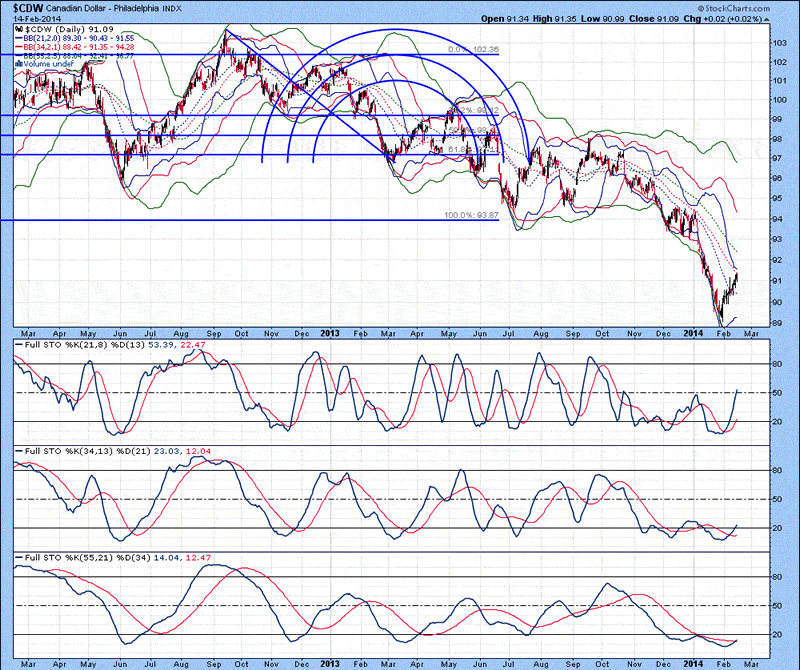
The daily chart of the Canadian Dollar Index is shown below, with lower Bollinger bands beneath the current price, suggestive that a bottom was put in place. Full stochastics 1, 2 and 3 are shown below in order of descent, with the %K above the %D in all three instances. Extrapolation of the %K trend in stochastics 1 and 2 suggest at least another 2-3 weeks of further upside before a top is put in place. I will post the monthly chart of the Canadian Dollar Index next week, which suggests the upward trend could last into next year. The Canadian Dollar has been in a down trend for over 18 months, so a bounce is expected.
Figure 1
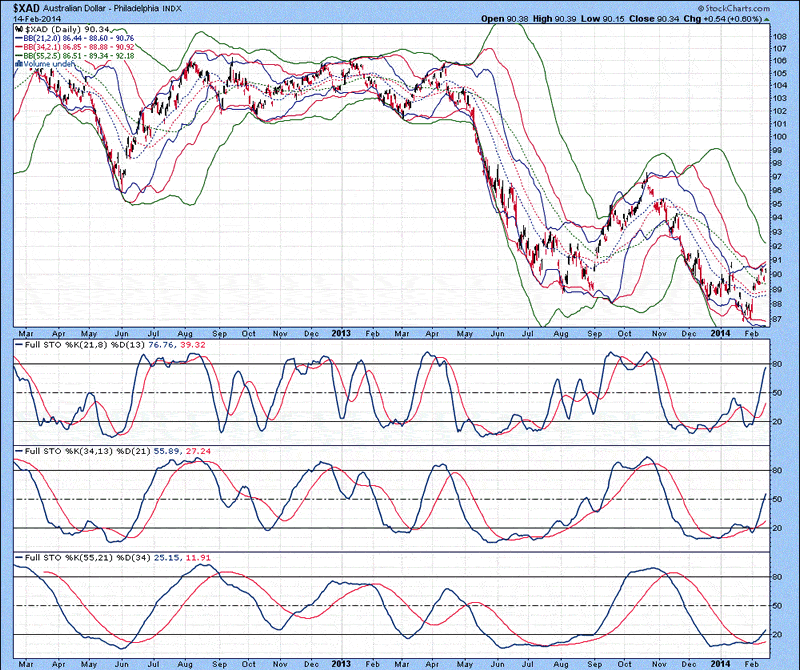
The daily chart of the US Dollar Index is shown below, with upper 21 and 34 MA Bollinger bands in close proximity to each other with rising stochastics, suggestive that further sideways to upward price action is likely. The lower 21 MA Bollinger band is beneath the 34 MA Bollinger band, suggestive that an oversold condition is developing. Full stochastics 1, 2 and 3 are shown below in order of descent, with the %K above the %D in all three instances. Extrapolation of the %K in stochastics 1 and 2 suggest at least another 2-3 weeks of further upward price action before a top is put in place. There is a noticeable positive divergence between stochastics 1 and 2 relative to the price action of the Aussie dollar, suggestive that further upward price action is pending.
Figure 2
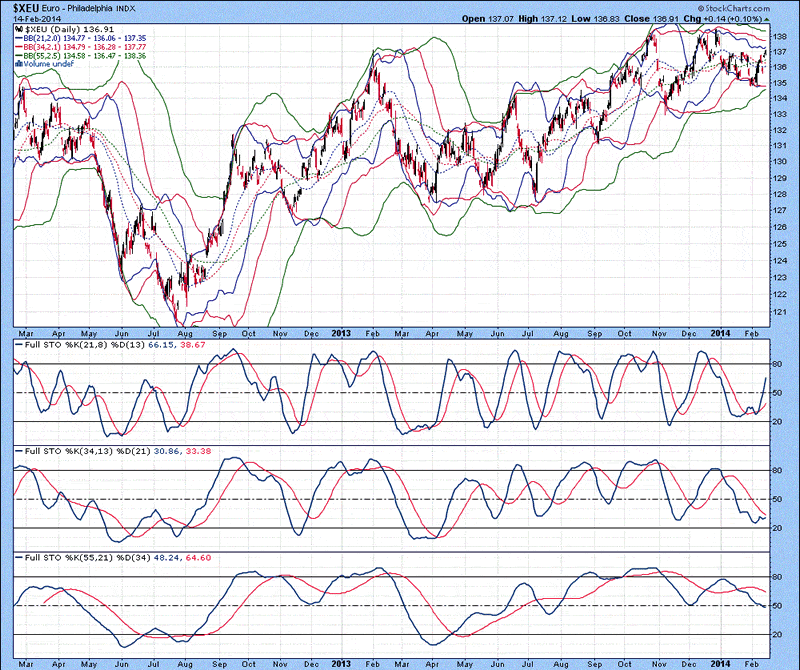
The daily chart of the Euro Index is shown below, with the lower 21 MA Bollinger band beneath the 34 MA Bollinger band, suggestive that an oversold condition is developing. Full stochastics 1, 2 and 3 are shown below in order of descent, with the %K above the %D in 1 and beneath the %D in 2 and 3. There are numerous levels of resistance between 137 and notably at 138, which had an island top put in place in late 2013. If the Euro can close above 138.3 on a daily basis, then an inverse head and shoulders pattern becomes activated, with an upside price objective to 143. A series of higher lows in the Euro have been put in place longer term since August 2012, providing no indication that a top has yet been put in place. The %K in stochastic 2 has yet to curl up, so the upward trend in the Euro could last 4-6 weeks before any sort of a top is put in place.
Figure 3
US Dollar Index
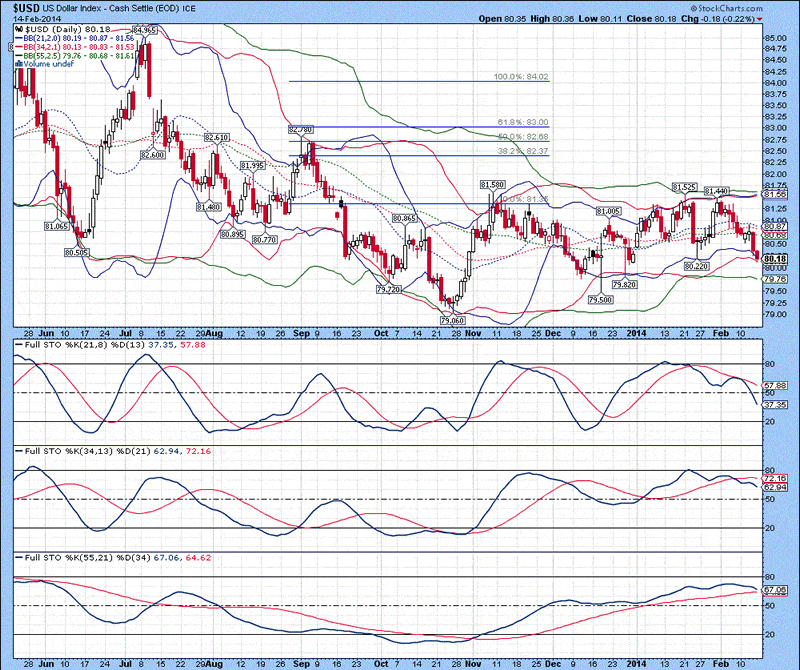
The daily chart of the US Dollar Index is shown below, with upper Bollinger bands in close proximity to each other above the current price, suggestive that further sideways to downward price action is likely. Lower 21 and 34 MA Bollinger bands are in close proximity to the current price, suggestive that further downward price action is likely Full stochastics 1, 2 and 3 are shown below in order of descent, with the %K beneath the %D in 1 and above the %D in 2 and 3. Extrapolation of the %K in stochastics 1 and 2 suggest at least another 3-4 weeks of further sideways to downward price action before a bottom is put in place. I have a lot of further technical information I could comment on, but have saved it for the short-term Elliott Wave count chart, as most of the technical information is better displayed there. The minimum downside for the current move is 79.0, which could happen within 2-3 weeks.
Figure 4
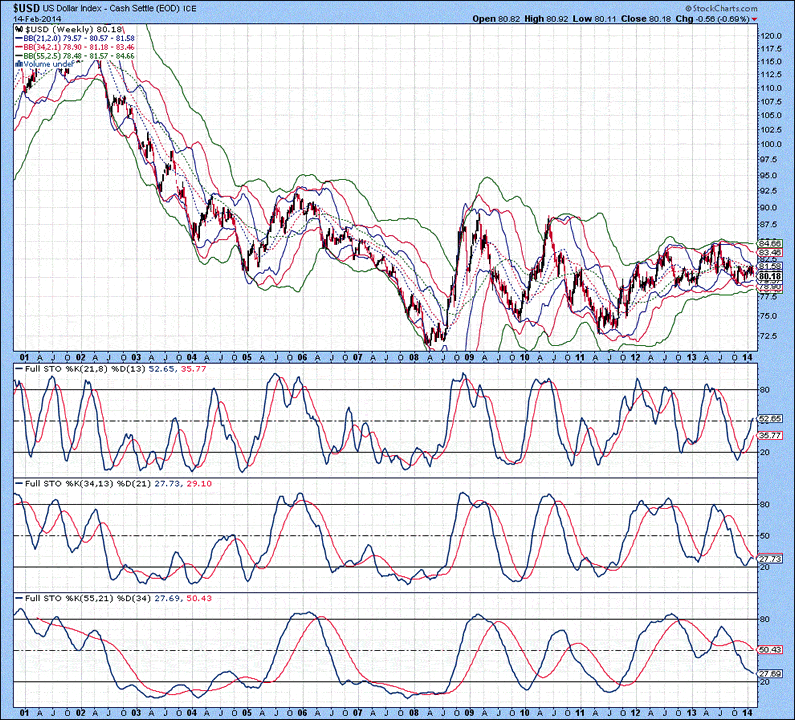
The weekly chart of the US Dollar Index is shown below, with Bollinger bands providing no indication of trend. Full stochastics 1, 2 and 3 are shown below in order of descent, with the %K above the %D in 1 and beneath the %D in 2 and 3. Although the %K in stochastic 1 is up, it appears the %K in stochastic 2 has curled down to match that of 3. The sideways consolidation of the US Dollar Index has been in effect for over 2 years now, so a break to the upside or downside is looming. A close below 79.0 signals much lower levels for the US Dollar Index, while a move above 81.7 signals a move to the upside. There are two head and shoulders pattern from 2012 until present (Refer to Figure 8) that have a unique thing happen if a close below 79.0 occurs. The first pattern was negated, but was followed by a second pattern, which doubles down the downside... 3 cents per pattern times 2 equals 6 cents. A break below 79 suggests a move down to 73.0 at minimum...more on this in Figure 8. Although the last two charts of this update contain Elliott Wave analysis, I highly recommend reviewing the commentary because the structural information was used to develop the retooled Wave count.
Figure 5
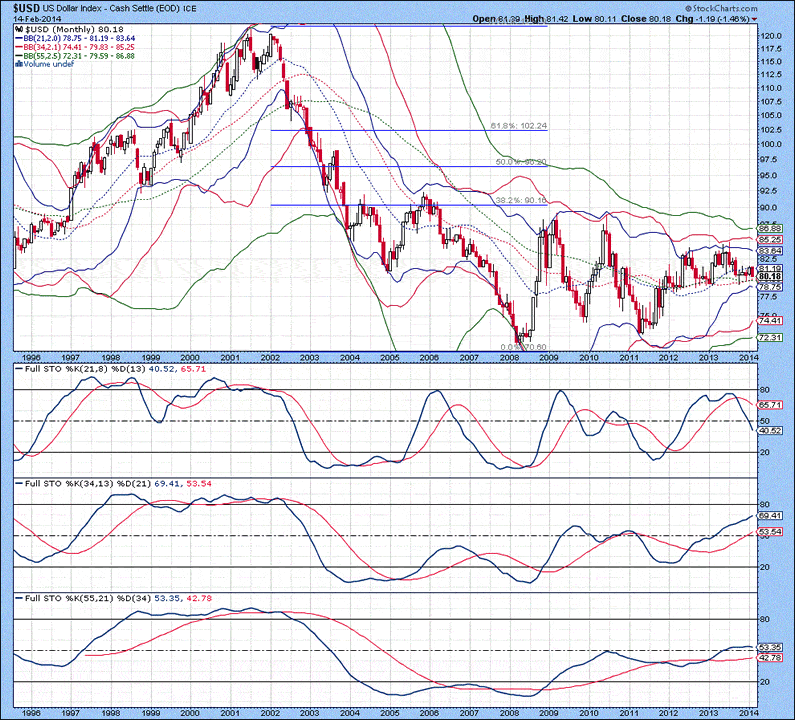
The monthly chart of the US Dollar Index is shown below, with Bollinger bands not providing any indication of trend. Full stochastics 1, 2 and 3 are shown below in order of descent, with the %K beneath the %D in 1 and above the %D in 2 and 3. Extrapolation of the %K trend in stochastic 1 suggests at least another 6-8 months of further sideways to downward price action before any sort of a top was put in place. Over the past 6 months, we have been looking for a breakout of the two year sideways trading pattern, whether it be to the upside or downside. Referring to Figure 7, it is clear that the trend is about set to break lower, even though the US Dollar is up on this Monday, February 17th, 2014. A decline in the US Dollar fits with a rising stock market, as well as commodities. A decline from 79.0 to 73.0 represents a loss of 8% purchasing power, which taken from the S&P 500 Indices current value of 1839 becomes 1989. If the S&P 500 Index approaches 2000 from current levels, it will really have the same “nominal value”, even though it is a fresh record high.
Figure 6
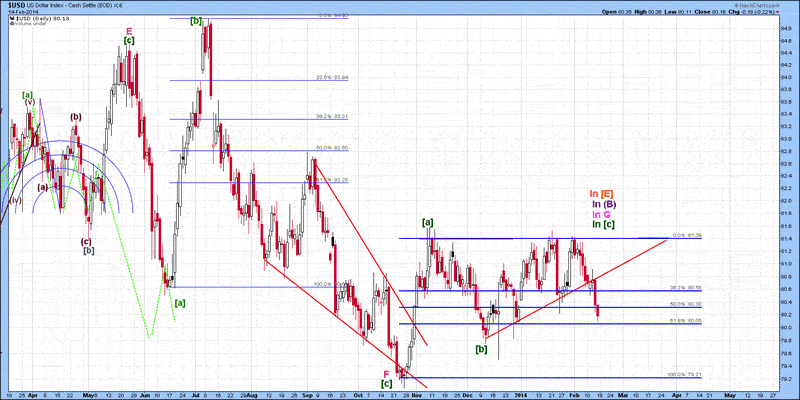
The short-term Elliott Wave count of the US Dollar Index is shown below, with wave [c].C either complete or nearing completion...the pattern is purely corrective, so it could extend for another 2-3 weeks. A daily close below 79.4 would confirm the illustrated pattern is complete. Until that point in time, we must assume that wave [c] is still forming a terminal impulse (3-3-3-3-3). As it will be more evident in Figure 8, I had to extend wave [E] because the amount of time required for a break to the upside invalidated the earlier count. As such, wave (C) is expected to take the US Dollar Index down to at least 73.0. The pattern for wave (B).[E] really fits a diametric triangle for the current pattern. I would expect a back test of the lower rising trend line after wave [b] before breaking lower, so expect sideways to upward price action in the US Dollar over the next 2-3 days.
Figure 7
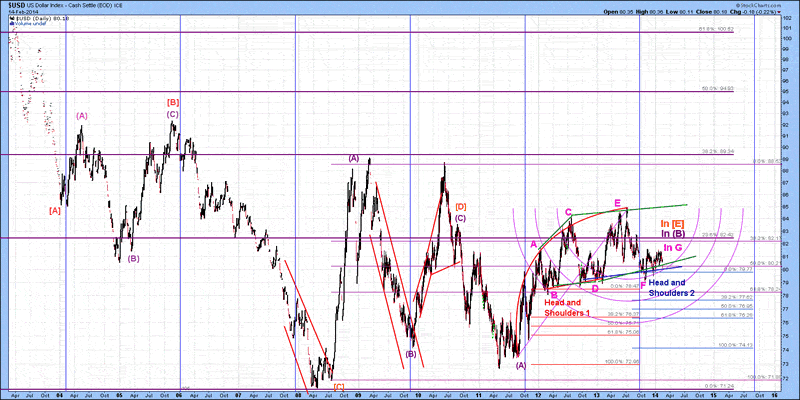
The mid-term Elliott Wave count of the US Dollar Index is shown below, with wave G.(B).[E] thought to still be forming. Each wave of the diametric triangle for wave (B) is approximately equal to each other in time and complexity, but vastly different in price. Wave (A).[E] took approximately 12 months, while wave (B) took approximately 29 months. If a flat structure is forming for wave [E], then wave (C) should consume at least 17 months (29 – 12 months) in order to have a balance of time between this structure. This would put a bottom in the US Dollar Index sometime in mid to late September 2015. I do want to stress that anyone who is not familiar with the Contracting Fibonacci Spiral (CFS) or Chirality and Chiral Inversion in the Stock Market, Google either title alongside my name to find a hyperlink to take you to a posting. As much to everyone's chagrin, the pattern appears to be playing out and is set to have a strong run up in commodity prices. There are numerous Fibonacci retracement levels presented in the chart below, which have some areas of cluster that represent either strong support or resistance. As mentioned earlier, there are two potential head and shoulders patterns, one denoted in red and the other in blue. The first H&S pattern was negated by a sharp move, but set up another H&S pattern. These sorts of patterns add collective downside potential, which makes things really break down fast when it happens. If wave (C).[E] were to start within 5-10 trading days, it would take until mid to late September 2015 to bottom, based upon the presented Elliott Wave count. I do want to stress that a move above 81.5 would negate this analysis and likely send the US Dollar Index much higher. Collective analysis of all the data presented in this article however suggests otherwise.
Figure 8
Based upon this, continue to hold or add to further precious metal positions. Regarding energy, a close above $101/barrel as mentioned last week remains the trigger to send energy prices and their related stocks much higher.
I will continue to be developing the forecast for post September 2015, which should see the broad stock market indices enter a 4 year decline, with three absolutely powerful reversal trends at the bottoms (2018, 2019 and 2020). The chiral inversion noted last summer appears to be holding and now a weakening US Dollar Index has finally provided the final information to confirm the trend. Back tomorrow AM. Have a great day.By David Petch
http://www.treasurechests.info
I generally try to write at least one editorial per week, although typically not as long as this one. At www.treasurechests.info , once per week (with updates if required), I track the Amex Gold BUGS Index, AMEX Oil Index, US Dollar Index, 10 Year US Treasury Index and the S&P 500 Index using various forms of technical analysis, including Elliott Wave. Captain Hook the site proprietor writes 2-3 articles per week on the “big picture” by tying in recent market action with numerous index ratios, money supply, COT positions etc. We also cover some 60 plus stocks in the precious metals, energy and base metals categories (with a focus on stocks around our provinces).
With the above being just one example of how we go about identifying value for investors, if this is the kind of analysis you are looking for we invite you to visit our site and discover more about how our service can further aid in achieving your financial goals. In this regard, whether it's top down macro-analysis designed to assist in opinion shaping and investment policy, or analysis on specific opportunities in the precious metals and energy sectors believed to possess exceptional value, like mindedly at Treasure Chests we in turn strive to provide the best value possible. So again, pay us a visit and discover why a small investment on your part could pay you handsome rewards in the not too distant future.
And of course if you have any questions, comments, or criticisms regarding the above, please feel free to drop us a line . We very much enjoy hearing from you on these items.
Disclaimer: The above is a matter of opinion and is not intended as investment advice. Information and analysis above are derived from sources and utilizing methods believed reliable, but we cannot accept responsibility for any trading losses you may incur as a result of this analysis. Comments within the text should not be construed as specific recommendations to buy or sell securities. Individuals should consult with their broker and personal financial advisors before engaging in any trading activities as we are not registered brokers or advisors. Certain statements included herein may constitute "forward-looking statements" with the meaning of certain securities legislative measures. Such forward-looking statements involve known and unknown risks, uncertainties and other factors that may cause the actual results, performance or achievements of the above mentioned companies, and / or industry results, to be materially different from any future results, performance or achievements expressed or implied by such forward-looking statements. Do your own due diligence.
Copyright © 2014 treasurechests.info Inc. All rights reserved.
Unless otherwise indicated, all materials on these pages are copyrighted by treasurechests.info Inc. No part of these pages, either text or image may be used for any purpose other than personal use. Therefore, reproduction, modification, storage in a retrieval system or retransmission, in any form or by any means, electronic, mechanical or otherwise, for reasons other than personal use, is strictly prohibited without prior written permission.
David Petch Archive |
© 2005-2022 http://www.MarketOracle.co.uk - The Market Oracle is a FREE Daily Financial Markets Analysis & Forecasting online publication.


