


U.S. Dollar Gains - Forex Trading Alerts
Currencies / Forex Trading Feb 26, 2014 - 10:17 PM GMTBy: Nadia_Simmons

 The U.S. dollar extended gains after stronger-than-expected U.S. home sales data. Earlier today, the Commerce Department showed that new home sales rose 9.6% to 468,000 units in January, while analysts had expected a 1% drop to 400,000. What impact did this largest increase in five-and-a-half years has on major currency pairs? If you want to know our take on this question, we invite you to read our today's Forex Trading Alert.
In our opinion the following forex trading positions are justified - summary:
- EUR/USD: short (stop-loss order: 1.3773, a downside price target: 1.3600)
- GBP/USD: none
- USD/JPY: none
- USD/CAD: short (stop-loss order: 1.1223, an initial price target: 1.0953)
- USD/CHF: none
- AUD/USD: none
EUR/USD
As you see on the above chart, earlier today, EUR/USD broke below the lower border of the rising trend channel and declined below the Feb.20 low. Therefore, our bearish scenario from the last Forex Trading Alert is up-to-date:
(…) we may see a decline even to around 1.3613 where the price target for the pattern is (please note that it corresponds to a height of the trend channel). More importantly, if the pair drops below the Feb. 20 low, we will likely see a post double top decline. In this case, the price target for the sellers will be around 1.3600 (marked with a light blue rectangle). From this perspective, in both cases we will likely see a decline below the upper border of the declining trend channel (marked with blue), which will be a strong negative signal that could trigger further deterioration.
Very short-term outlook: bearish
Short-term outlook: mixed with bearish bias
MT outlook: mixed
LT outlook: bearish
Trading position (short-term; our opinion): Short. A stop-loss order: 1.3773 and a downside price target: 1.3600.
GBP/USD
In our last Forex Trading Alert, we wrote the following:
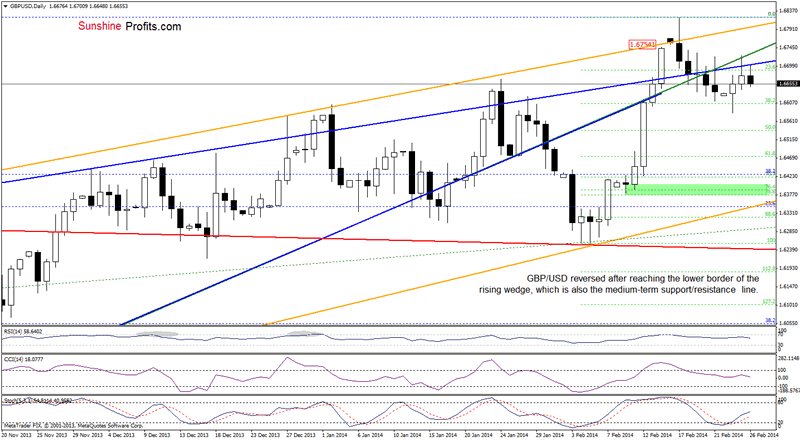
(…) a corrective upswing (…) took the pair to the previously-broken lower border of the rising wedge (…) if this strong resistance line encourages sellers to act, we will likely see another attempt to move below the 38.2% Fibonacci retracement. Please note that this scenario is reinforced by the fact that GBP/USD confirmed a breakdown below this medium-term resistance line in recent days (we saw four consecutive closes).
Yesterday, GBP/USD gave up the gains and reversed, finishing the day for the fifth time in a row below the lower border of the rising wedge. From this perspective, it seems that the recent upswing was nothing more than a verification of the breakdown, which is a bearish signal. If this is the case, we will likely see a drop to (at least) the 38.2% Fibonacci retracement in the coming day (or days).
Very short-term outlook: mixed
Short-term outlook: mixed
MT outlook: mixed
LT outlook: mixed
Trading position (short-term): In our opinion no positions are justified from the risk/reward perspective at the moment as the current situation is unclear.
USD/JPY
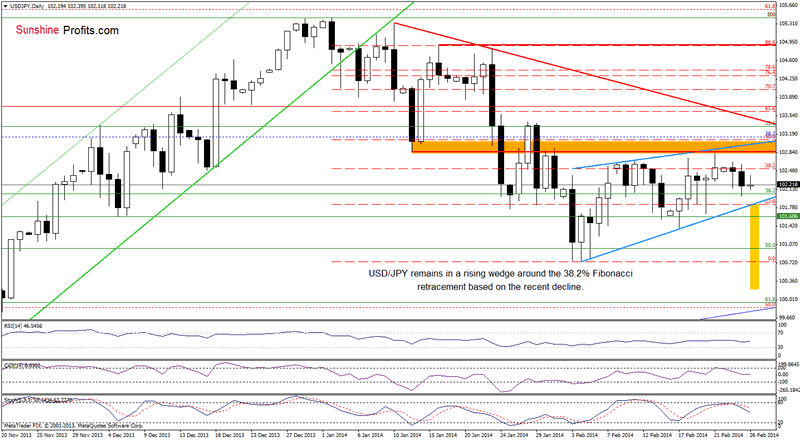
From this perspective, we see that the situation hasn’t changed much as USD/JPY remains in the rising wedge (marked with light blue) between the 23.6% and 38.2% Fibonacci retracement level (based on the recent decline). So, what we wrote in yesterday’s Forex Trading Alert is still up-to-date.
(…) as long as there is no breakout above the upper line (or a breakdown below the lower border) a bigger upswing (or downswing) is not likely to be seen. (…) the upper line is currently reinforced by a resistance zone created by the Jan.13 low and Jan.31 high (marked with orange). If this resistance is broken, we will likely see an upward move to at least the declining resistance line based on the Jan.10 and Jan.23 highs (marked with red). However, if this strong resistance encourages sellers to act, we will see a drop to the lower border of the rising wedge in the near future. If the pair drops below this important support line, we will probably see a re-test of the strength of the February low. At this point it’s worth noting that the price target after a breakdown is a bit lower than the monthly low and we marked it with a yellow rectangle. Looking at the position of the indicators, we see that the CCI generated a sell signal and Stochastic Oscillator is close to doing it. So, a bearish scenario is more likely at the moment.
Very short-term outlook: mixed
Short-term outlook: mixed with bearish bias
MT outlook: bullish
LT outlook: bearish
Trading position (short-term): In our opinion, the situation is too unclear to go short or long at the moment. So, no positions are justified from the risk/reward perspective.
USD/CAD
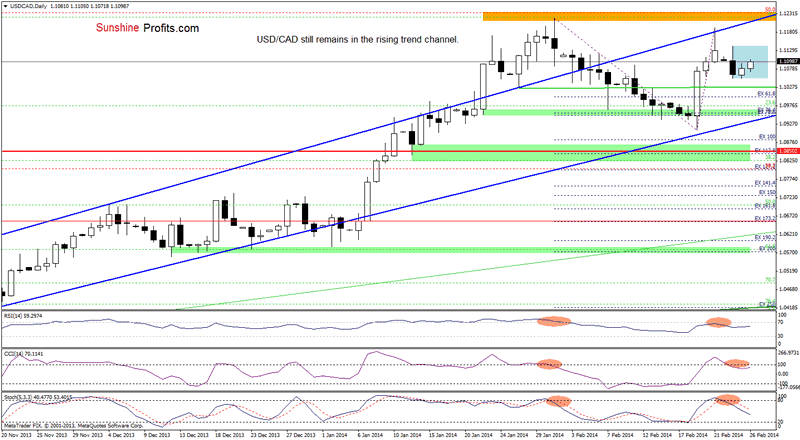
As you see on the daily chart, the situation has improved as USD/CAD moved higher earlier today. Despite this increase, the pair remains in a consolidation range (marked with light blue) between Monday high and low. From this perspective, if the exchange rate climbs above the upper border of this formation, we may see further improvement and the first upside target would be the Feb.21 high (slightly below the upper line of the rising trend channel). However, we should keep in mind that all indicators support sellers at the moment as sell signals remain in place.
Very short-term outlook: mixed
Short-term outlook: mixed
MT outlook: bullish
LT outlook: bearish
Trading position (short-term; out opinion): Short. Stop-loss order: 1.1223, and an initial price target: 1.0953.
USD/CHF
Quoting our last Forex Trading Alert:
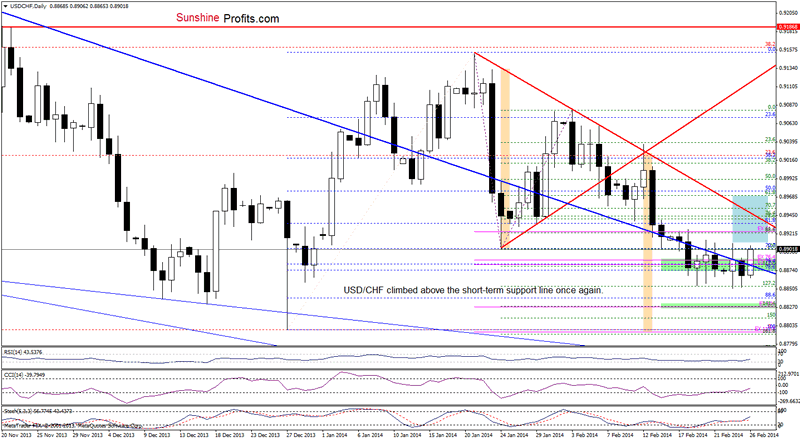
(…) the pair dropped below a support zone (marked with green), which suggests that we will likely see a re-test of the strength of the February low in the nearest future. If this support level holds, we may see another attempt to invalidate the breakdown below the major resistance line.
Yesterday, we saw such price action as USD/CHF almost touched the monthly low. Earlier today, this support level encouraged buyers to act, which resulted in a sharp corrective upswing that took the pair above the short-term resistance line (marked with blue). Although this is a positive signal, we saw similar increases in recent days. So far, none of them brought buyers a victory and the exchange rate reversed. From this perspective, as long as the pair does not close the day above this major resistance line, another attempt to move lower can’t be ruled out. Nevertheless, we would like to draw your attention to the fact that all indicators support buyers at the moment (the CCI and Stochastic Oscillator generated buy signals). Taking this fact into account, if USD/CHF climbs above yesterday’s high, we may see a post double bottom rally. In this case, the price target for the pattern would be around 0.8968. However, we should keep in mind that before buyers realize this scenario, they will have to break above the very short-term declining line (marked with red), which may not be so easy, because this resistance line successfully stopped (even several times) further improvement earlier this month.
Very short-term outlook: mixed
Short-term outlook: mixed
MT outlook: bearish
LT outlook: bearish
Trading position (short-term): In our opinion, the situation is too unclear to go long or short at the moment.
AUD/USD
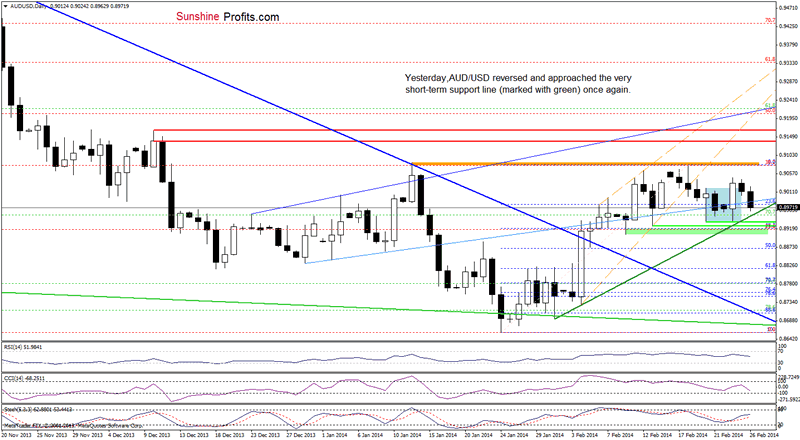
Earlier today, AUD/USD extended losses and almost dropped to the very short-term rising support line (marked with green), which remains the nearest major support. If this important line holds and encourages buyers to act, we may see a corrective upswing (similarly to what we saw on Monday) and a comeback to around this week high. However, if it is broken, we will likely see further deterioration and a drop to a support zone created by the Feb.13 and Feb.20 lows. Please note that slightly below this area is also the Feb.10 low (currently reinforced by the 38.2% Fibonacci retracement level based on the recent rally), which may pause or even stop further declines.
Very short-term outlook: mixed
Short-term outlook: mixed
MT outlook: bearish
LT outlook: bearish
Trading position (short-term): In our opinion, opening any positions at the moment is not a good idea as AUD/USD remains between an important support line and a strong resistance zone created by the February high and the 38.2% Fibonacci retracement level.
Thank you.
Nadia Simmons
Sunshine Profits‘ Contributing Author
Oil Investment Updates
Oil Trading Alerts
* * * * *
Disclaimer
All essays, research and information found above represent analyses and opinions of Nadia Simmons and Sunshine Profits' associates only. As such, it may prove wrong and be a subject to change without notice. Opinions and analyses were based on data available to authors of respective essays at the time of writing. Although the information provided above is based on careful research and sources that are believed to be accurate, Nadia Simmons and his associates do not guarantee the accuracy or thoroughness of the data or information reported. The opinions published above are neither an offer nor a recommendation to purchase or sell any securities. Nadia Simmons is not a Registered Securities Advisor. By reading Nadia Simmons’ reports you fully agree that he will not be held responsible or liable for any decisions you make regarding any information provided in these reports. Investing, trading and speculation in any financial markets may involve high risk of loss. Nadia Simmons, Sunshine Profits' employees and affiliates as well as members of their families may have a short or long position in any securities, including those mentioned in any of the reports or essays, and may make additional purchases and/or sales of those securities without notice.
© 2005-2022 http://www.MarketOracle.co.uk - The Market Oracle is a FREE Daily Financial Markets Analysis & Forecasting online publication.