


Triangles Offer Traders Important Forecasting Information
InvestorEducation / Learn to Trade Apr 10, 2014 - 02:24 PM GMTBy: EWI

 Find out about 14 Elliott wave trading insights
These days there's no shortage of books about trading. You could read for months before you find a book that applies to your trading style.
The free 45-page eBook -- The Best of Trader's Classroom -- is specifically for Elliott wave traders. This excellent eBook will save time and deliver the knowledge you want.
It's written by Elliott wave trader Jeffrey Kennedy: He had individuals like you in mind when he said:
I began my career as a small trader, so I know firsthand how hard it can be to get simple explanations of methods that consistently work. In more than 15 years as an analyst since my early trading days, I've learned many lessons, and I don't think that they should have to be learned the hard way.
The Best of Trader's Classroom offers 14 trading insights that you can use.
Consider these examples of what you'll learn:
-- Use bar patterns to spot trading setups
-- Use the Wave Principle to set protective stops
-- Identify Fibonacci retracements
-- Apply Fibonacci ratios to real-world trading
Jeffrey also discusses corrective patterns, including the triangle formation. Here's an edited excerpt:
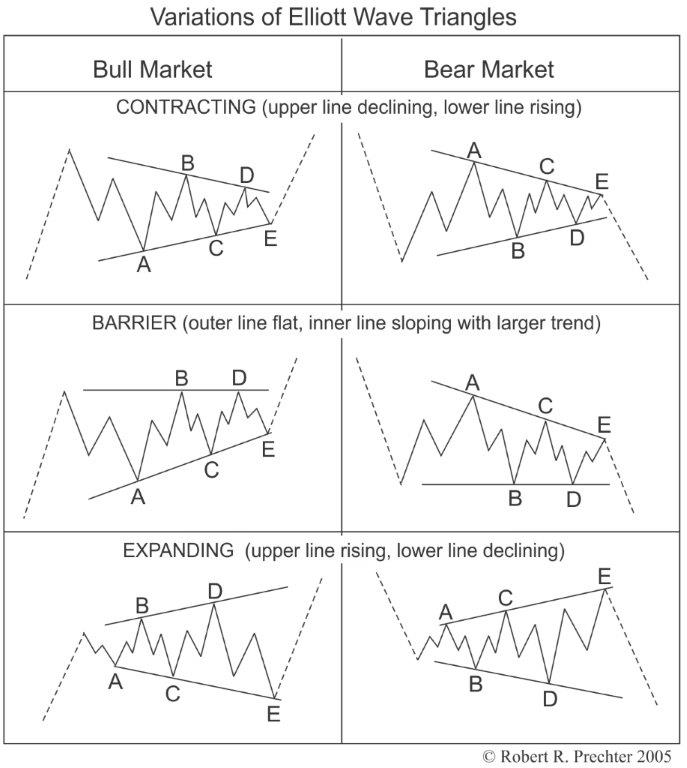
Triangles are probably the easiest corrective wave pattern to identify, because prices simply trade sideways during these periods. [The graphic below] shows the different shapes triangles can take.
Triangles offer an important piece of forecasting information -- they only occur just prior to the final wave of a sequence. This is why triangles are strictly limited to the wave four, B or X positions. In other words, if you run into a triangle, you know the train is coming into the station.
Jeffrey goes on to provide three real-world examples of the triangle price pattern. Here's one of them with his accompanying commentary.
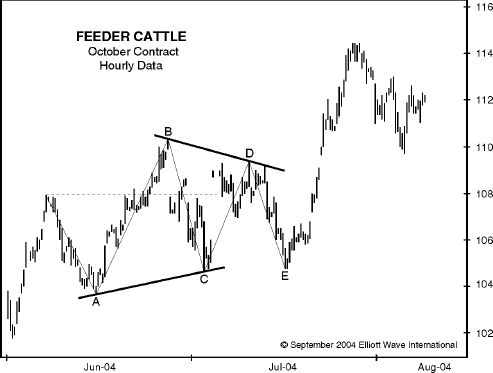
[The chart above] shows a slight variation of a contracting triangle, called a running triangle. A running triangle occurs when wave B makes a new extreme beyond the origin of wave A. This type of corrective wave pattern occurs frequently in commodities.
|
Learn more about Jeffrey Kennedy's 14 trading insights in The Best of Trader's Classroom. This chart-packed 45-page eBook is yours to access FREE after you join Club EWI. Membership is also free. Follow this link for your free download of The Best of Trader's Classroom. |
This article was syndicated by Elliott Wave International and was originally published under the headline Triangles Offer Traders Important Forecasting Information. EWI is the world's largest market forecasting firm. Its staff of full-time analysts led by Chartered Market Technician Robert Prechter provides 24-hour-a-day market analysis to institutional and private investors around the world.
About the Publisher, Elliott Wave International
Founded in 1979 by Robert R. Prechter Jr., Elliott Wave International (EWI) is the world's largest market forecasting firm. Its staff of full-time analysts provides 24-hour-a-day market analysis to institutional and private investors around the world.
© 2005-2022 http://www.MarketOracle.co.uk - The Market Oracle is a FREE Daily Financial Markets Analysis & Forecasting online publication.