


Nikkei Stock Market - Sell Japan
Stock-Markets / Japanese Stock Market Apr 20, 2014 - 12:30 PM GMT

 Bottom line: Sell Japan, I think both markets still need at least one more leg lower to complete a corrective WXY decline from their respective peaks.
USDJPY
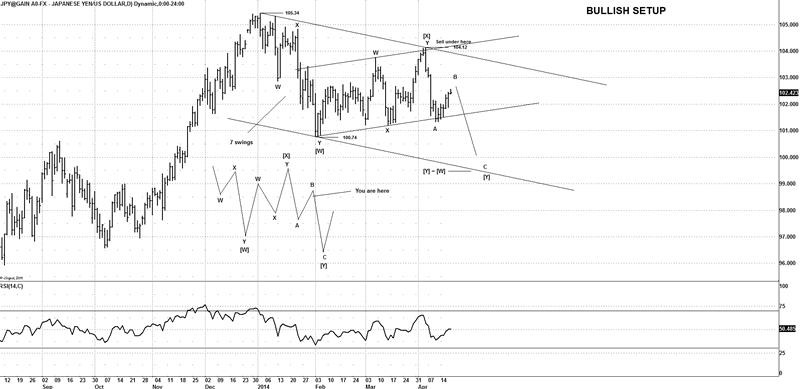
If you take a non-biased approach and simply counted the decline as you see it, you can clearly see there are 7 swings from 105.34 - 100.74, so by definition it's a corrective decline, or part of a larger more complex pattern. The move from 100.74 - 104.12 is also a corrective set of waves and thus labeled a corrective bounce.
This would still imply that USDJPY should see a move back under 100.74 to complete a potential WXY correction from 105.34, ideally targeting towards 99.50.
The market is bearish under 104.12; whilst it remains under that area we should see at least a new swing low under 100.74. Resistance is between 102.80 - 103.50 but it's subject to the current bounce.
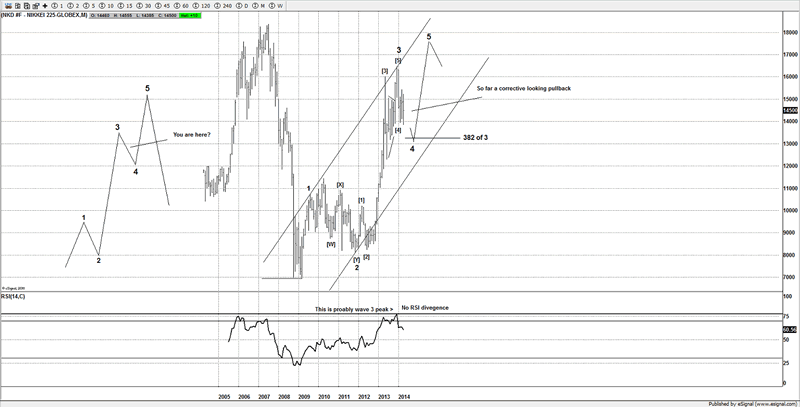
NIK-225
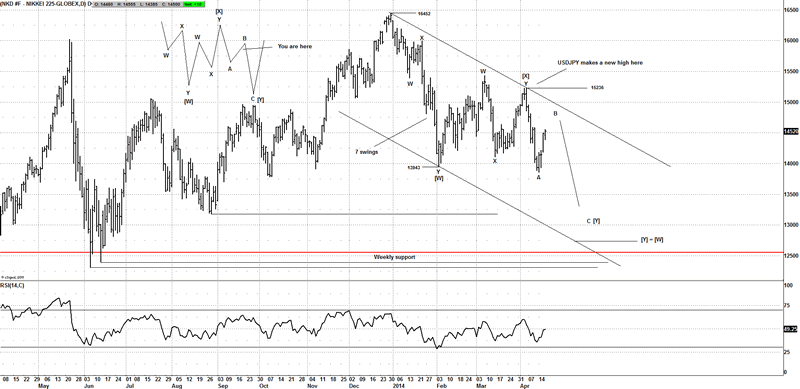
The decline from 16452 - 13943 appears to be a 7 swing move, so by definition it's a corrective decline or at least part of a larger more complex pattern.
The move from 13943 - 15236 is again a corrective series of waves; if you take a closer look you will notice the large divergence between the 2 markets, a sure sign of an impending reversal.
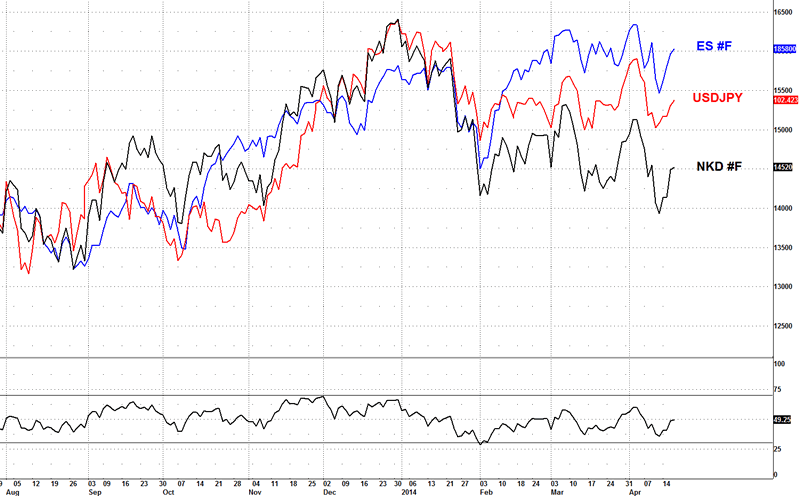
When we see this inter-market divergence it's generally seen at reversal points, in this case it was a peak for both markets, but we can also see that sort of divergence at major lows as well, 2 markets that follow in each other's footsteps suddenly diverge from one another.
Whilst the NIK-225 is under 15236 we should see at least a new low towards 13500 possibly towards 13000 depending on the next decline.
Based upon the current wave structure it still appears to be missing at least another leg lower in both markets, so the moral of the story is to look to sell Japan for a move lower.
USDJPY is bearish below 104.12
NIK-225 is bearish below 15236
NIK-225 = NIK-225 futures not the cash market
It's now closing in on my initial target I had targeted back in Dec 2013, way before this current decline, such is the power of Elliott Wave used in the right hands.
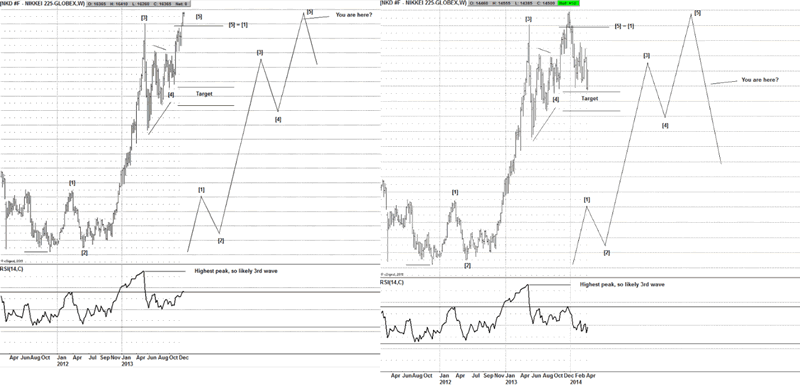
If it remains as a corrective looking decline, then it could potentially be a large 4th wave, which would imply new yearly highs to come before the trend is finished from the 2009 lows.
Until next time
Have a profitable week ahead
Click here to become a member
You can also follow us on twitter
What do we offer?
Short and long term analysis on US and European markets, various major FX pairs, commodities from Gold and silver to markets like natural gas.
Daily analysis on where I think the market is going with key support and resistance areas, we move and adjust as the market adjusts.
A chat room where members can discuss ideas with me or other members.
Members get to know who is moving the markets in the S&P pits*
*I have permission to post comments from the audio I hear from the S&P pits.
If you looking for quality analysis from someone that actually looks at multiple charts and works hard at providing members information to stay on the right side of the trends and making $$$, why not give the site a trial.
If any of the readers want to see this article in a PDF format.
Please send an e-mail to Enquires@wavepatterntraders.com
Please put in the header PDF, or make it known that you want to be added to the mailing list for any future articles.
Or if you have any questions about becoming a member, please use the email address above.
If you like what you see, or want to see more of my work, then please sign up for the 4 week trial.
This article is just a small portion of the markets I follow.
I cover many markets, from FX to US equities, right the way through to commodities.
If I have the data I am more than willing to offer requests to members.
Currently new members can sign up for a 4 week free trial to test drive the site, and see if my work can help in your trading and if it meets your requirements.
If you don't like what you see, then drop me an email within the 1st 4 weeks from when you join, and ask for a no questions refund.
You simply have nothing to lose.
By Jason Soni AKA Nouf
© 2014 Copyright Jason Soni AKA Nouf - All Rights Reserved
Disclaimer: The above is a matter of opinion provided for general information purposes only and is not intended as investment advice. Information and analysis above are derived from sources and utilising methods believed to be reliable, but we cannot accept responsibility for any losses you may incur as a result of this analysis. Individuals should consult with their personal financial advisors.
WavePatternTraders Archive |
© 2005-2022 http://www.MarketOracle.co.uk - The Market Oracle is a FREE Daily Financial Markets Analysis & Forecasting online publication.