


Stock Market Is Weak in the Knees
Stock-Markets / Stock Markets 2014 Apr 23, 2014 - 05:08 AM GMTBy: Investment_U

 Christopher Rowe writes: The granddaddy of all stock market indicators, the New York Stock Exchange Bullish Percent Index (NYSE BPI), tells us how risky the market it is.
The indicator right now is showing a market that is losing momentum. I'll explain...
The NYSE BPI shows the percentage of stocks that are on "point and figure" buy signals.
A P&F buy signal is very much like any other buy signal when looking at a price chart. The buy signal is established when a stock breaks through its historical resistance price.
The stock remains on a P&F buy signal until it moves to a sell signal, which is established when the stock drops below its historical support price.
Stocks on buy signals tend to more easily advance until they run into some other historical resistance level. Those on sell signals tend to keep declining until they hit a previously established support price.
Thus, when we notice a trend of more and more stocks moving to buy signals, we know that the "demand side" has taken control of market prices.
Interpreting the Signal
The higher the reading, the more risk there is in the market. That's because if most stocks are already on buy signals, it's likely that most of the buying has already happened. The lower the reading, the lower the risk. When most stocks are already on sell signals, it's likely that most of the selling has already occurred.
When the reading is trending up, it means more and more stocks are moving to buy signals. It's best to run bullish trades when the reading is trending up.
If the reading is low (indicating low market risk) but is still trending lower, it's best to wait until the BPI reverses and starts trending higher.
The very best time to run bullish trades is when the NYSE BPI is in low-risk territory, but trending higher. The riskiest time to run bullish trades is when the BPI is in overbought territory and trending lower.
Below is an NYSE BPI chart. Notice it's just a chart with columns of mostly X's and O's. The reading is presented as a point and figure chart. Instead of making this a point and figure charting lesson, just focus on the column to the far right, which is the most recent time period.
Currently, that column is in X's. That means the most recent trend is more stocks moving to buy signals. Demand is in control. When the most recent column is O's, more stocks are moving to sell signals and it's time to be more defensive.
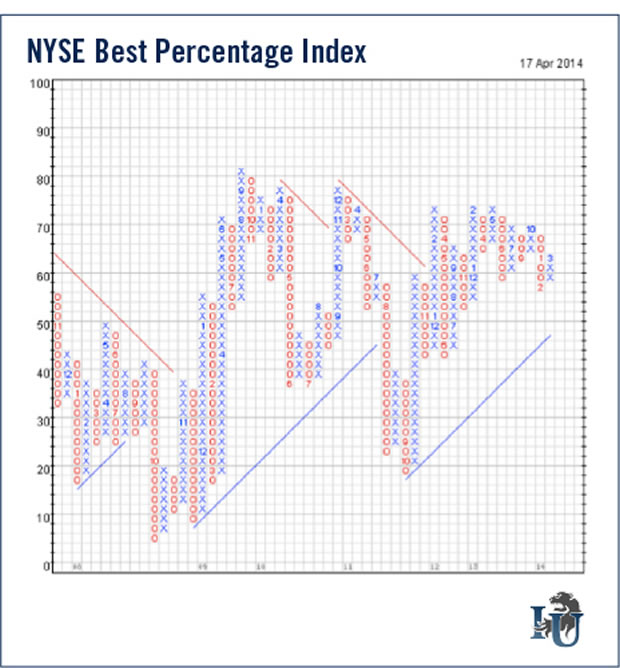
The rule of thumb is when the NYSE BPI is at 70 or higher, the market is in overbought territory (but it's not time to be defensive or bearish until the reading moves back below 70 and is in O's).
If the NYSE BPI is below 30, the market is in oversold territory. When the chart turns positive again (a column of X's) it's time to run bullish plays, because the risk is low and the market is probably washed out (most of the selling has already happened).
The last seven columns of X's and O's are showing lower highs and lower lows. Lower highs means that with each market advance (since mid-2013) fewer and fewer stocks were on buy signals. There are fewer stocks participating in each advance. Lower lows means that more stocks are participating in each market sell-off.
That's information you can't get by simply watching the market-cap weighted averages like the S&P 500 or the Nasdaq. While the averages have shown higher highs, the reality is the internal market is weakening.
Think of the stock market like an opponent in a boxing match and understand that a punch might have a minor effect in the first few seconds of round one, but a more devastating effect toward the end of round nine.
The market seems to be weak in the knees at this point.
Currently, demand is in control of the shorter-term trend as the NYSE BPI is in X's. But here's a link so that you can check back with the chart regularly. When the column to the far right flips to a column of O's, it's time to exercise caution as supply has taken control once again.
Good investing,
Chris
Source: http://www.investmentu.com/article/detail/36850/bullish-percent-index-market-weak-in-knees
Copyright © 1999 - 2014 by The Oxford Club, L.L.C All Rights Reserved. Protected by copyright laws of the United States and international treaties. Any reproduction, copying, or redistribution (electronic or otherwise, including on the world wide web), of content from this website, in whole or in part, is strictly prohibited without the express written permission of Investment U, Attn: Member Services , 105 West Monument Street, Baltimore, MD 21201 Email: CustomerService@InvestmentU.com
Disclaimer: Investment U Disclaimer: Nothing published by Investment U should be considered personalized investment advice. Although our employees may answer your general customer service questions, they are not licensed under securities laws to address your particular investment situation. No communication by our employees to you should be deemed as personalized investment advice. We expressly forbid our writers from having a financial interest in any security recommended to our readers. All of our employees and agents must wait 24 hours after on-line publication or 72 hours after the mailing of printed-only publication prior to following an initial recommendation. Any investments recommended by Investment U should be made only after consulting with your investment advisor and only after reviewing the prospectus or financial statements of the company.
Investment U Archive |
© 2005-2022 http://www.MarketOracle.co.uk - The Market Oracle is a FREE Daily Financial Markets Analysis & Forecasting online publication.