


The Great Recession Grinds On - Measuring Misery around the World
Politics / Social Issues Apr 24, 2014 - 03:35 PM GMTBy: Steve_H_Hanke

 The Great Recession grinds on. And as it does, politicians of all stripes ask, usually behind closed doors, "Just how miserable are our citizens?" The chattering classes offer a variety of opinions. As it turns out, there is a straightforward way to measure what is termed the misery index.
The late Arthur Okun, a distinguished economist who served as chairman of the President’s Council of Economic Advisers during President Johnson’s administration, developed the original misery index for the United States. Okun’s index is equal to the sum of the inflation and unemployment rates.
“The misery index pours cold water on the current critique of free markets and fiscal austerity. ”
Harvard Professor Robert Barro amended the misery index by also including the 30-year government bond yield and the output gap for real GDP. Barro used his index to measure the change in misery during a president’s term.
From these metrics, we would anticipate that if there were a high level of misery in a country, and the current politicians increased the level of misery, then this increase would be borne out by looking at the polls. In other words, we expect citizens to be aware of misery, and approve or disapprove accordingly.
The data in the misery index chart speak loudly. Contrary to left-wing dogma, the Reagan "free-market years, " were very good ones. And the Clinton years of Victorian fiscal virtues– when President Clinton proclaimed in his January 1996 State of the Union address: "the era of big government is over" — were also very good ones.
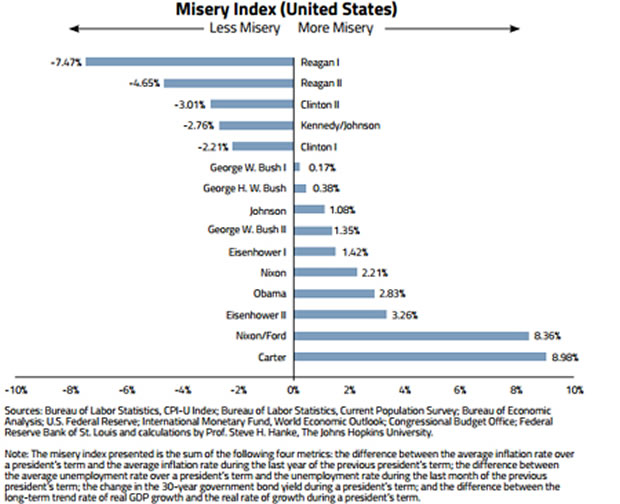
The misery index pours cold water on the current critique of free markets and fiscal austerity — a critique that has taken on the characteristics of a religion embraced without investigation. Indeed, it makes one bothered to subject their ideas to a reality check.
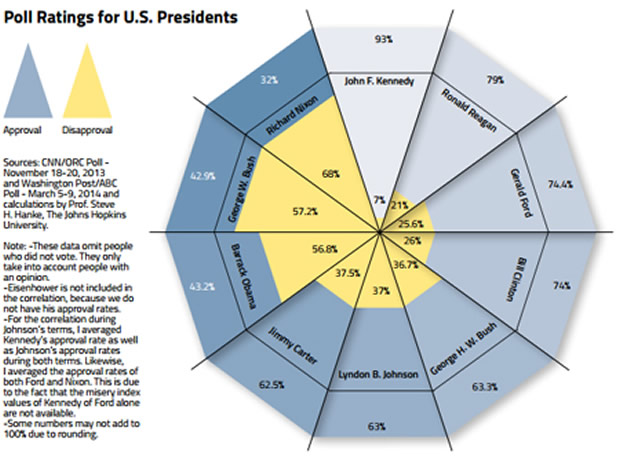
But does the misery index accurately measure misery? Well, when looking at the relationship between a president’s approval ratings and the misery index, the truth comes into sharp relief. If the economy is doing poorly during a president’s term, the likelihood for this president to have a low approval rate is high, and vice versa (correlation of -0. 54). By examining the misery index ranking in the United States and the poll ratings of U. S. Presidents (compare the first two charts), the correlation becomes apparent.
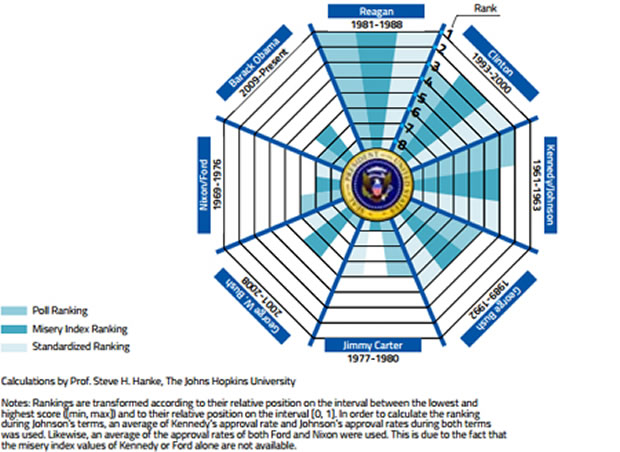
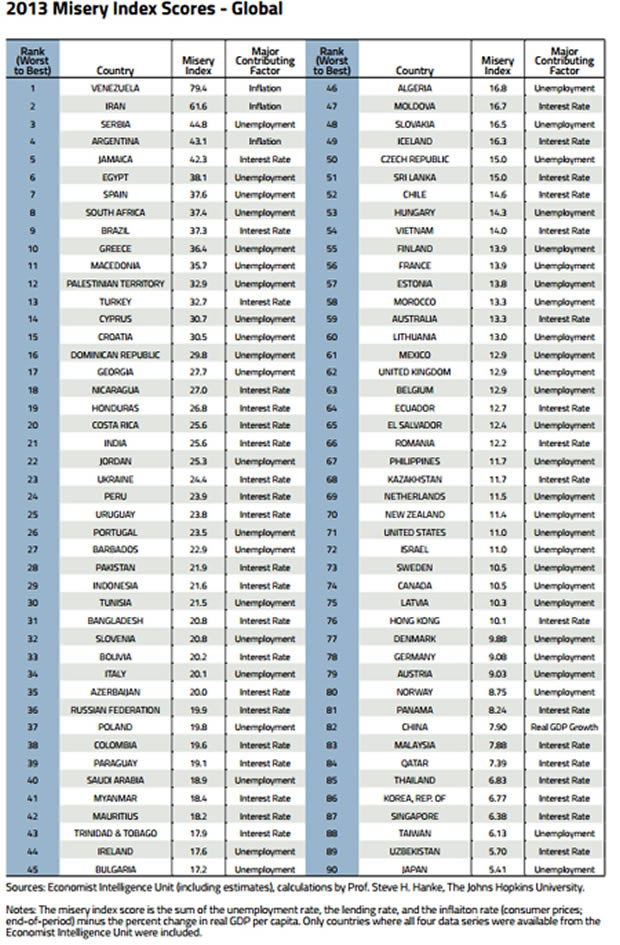
For most people, their quality of life is important. Constituents prefer lower inflation rates, lower unemployment rates, lower lending rates, and higher GDP per capita. By combining the poll rankings and the misery index, we calculate a standardized ranking from one president to another (see chart on the right). This type of analysis is not limited to the United States. The misery index concept can be applied to any country where suitable data exist. A misery index — a simple sum of inflation, lending rates, and unemployment rates, minus year-on-year per capita GDP growth — is used to construct a ranking for 90 countries (see the PHOTO misery index scores, page 24).
When measured by the misery index, Venezuela holds the ignominious top spot, with an index value of 79. 4. But, that index value, as of 31 December 2013, under states the level of misery because it uses the official annual inflation rate of 56. 2%. In fact, I estimate that Venezuela’s annual implied inflation rate at the end of last year was 278%. That rate is almost five times higher than the official inflation rate. If the annual implied inflation rate of 278% is used to calculate Venezuela’s misery index, the index jumps from 79. 4 to 301, indicating that Venezuela is in much worse shape than suggested by the official data.
Why is there such a huge gap between the official inflation rate and my estimate of the true inflation rate? Venezuela imposes a complex web of government price controls. In consequence, when one observes prices for the items that comprise Venezuela’s price index, many of the prices will be those mandated by the government, not the market. So, the inflation rates for the basket will be artificially low. The official inflation reading will be for what is termed "suppressed" inflation.
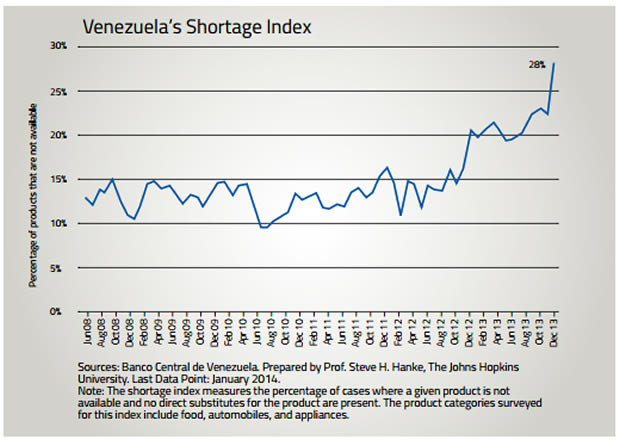
And that’s not the end of the story. Indeed, with binding price controls, many goods in the official price index basket are nowhere to be found. And when it comes to price-control induced shortages, there is no better authority than Milton Friedman:
"We economists don’t know much, but we do know how to create a shortage. If you want to create a shortage of tomatoes, for example, just pass a law that retailers can’t sell tomatoes for more than two cents perpound. Instantly you’ll have a tomato shortage. It’s the same with oil or gas."
The accompanying chart (page 25) confirms Friedman’s observation. In Venezuela, 28% of basic products are not available.
When price controls and shortages prevail, how do we measure the true rate of inflation — "open" inflation?
Binding price controls spawn black markets. Many of the goods and services subject to controls migrate to black markets. For example, in German-occupied Poland during World War II, price controls prevailed and the black market flourished. Everything from basic food and industrial goods to foreign exchange traded on black markets. There was even an illegal stock market. The scale of the black markets was impressive, with 80% of all food being supplied via illegal markets.
One way to estimate the rate of true, open inflation, in cases such as Venezuela’s, would be to track down the free-market prices — including the black-market prices — for all goods in the official basket. But such a procedure would be very difficult, if not virtually impossible, to implement. That is why no country has ever accomplished such a herculean task.
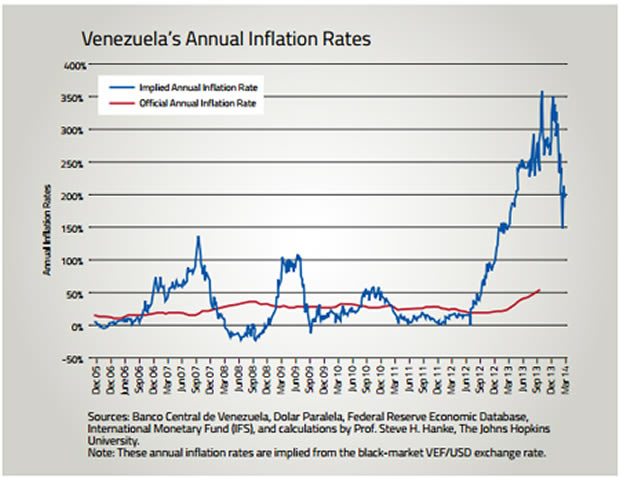
As an alternative, I have developed a procedure for estimating the true, open inflation rate for an economy in the grip of high inflation and price controls. While it is impractical to determine the free-market (read: black-market) prices for all items in an official basket, it is often quite easy to observe the free, black-market exchange rate. Since this is the most important price in the economy, changes in the free, black-market exchange rate can be used to estimate the true, open inflation rate for an economy.
By using the most important free-market price in Venezuela — the black — market bolivar / U. S. dollar rate — we can accurately estimate Venezuela’s annual open inflation rate (see the accompanying chart). At the end of 2013, this true, open inflation rate was five times higher than the official rate. And the associated true misery index was 301, not 79. 4.
It’s not surprising that President Maduro’s popularity has plunged 16 percentage points since he took office in April 2013. And if that wasn’t bad enough, politically-motivated street violence has claimed 39 lives since mid-February 2014.
By Steve H. Hanke
www.cato.org/people/hanke.html
Twitter: @Steve_Hanke
Steve H. Hanke is a Professor of Applied Economics and Co-Director of the Institute for Applied Economics, Global Health, and the Study of Business Enterprise at The Johns Hopkins University in Baltimore. Prof. Hanke is also a Senior Fellow at the Cato Institute in Washington, D.C.; a Distinguished Professor at the Universitas Pelita Harapan in Jakarta, Indonesia; a Senior Advisor at the Renmin University of China’s International Monetary Research Institute in Beijing; a Special Counselor to the Center for Financial Stability in New York; a member of the National Bank of Kuwait’s International Advisory Board (chaired by Sir John Major); a member of the Financial Advisory Council of the United Arab Emirates; and a contributing editor at Globe Asia Magazine.
Copyright © 2014 Steve H. Hanke - All Rights Reserved
Disclaimer: The above is a matter of opinion provided for general information purposes only and is not intended as investment advice. Information and analysis above are derived from sources and utilising methods believed to be reliable, but we cannot accept responsibility for any losses you may incur as a result of this analysis. Individuals should consult with their personal financial advisors.
Steve H. Hanke Archive |
© 2005-2022 http://www.MarketOracle.co.uk - The Market Oracle is a FREE Daily Financial Markets Analysis & Forecasting online publication.