


Stock Market Bubble Phase: Gold Capitulation Follow Up
Stock-Markets / Financial Markets 2014 Apr 27, 2014 - 06:16 PM GMTBy: Toby_Connor

 At the beginning of the month I theorized that stocks were about to enter a final bubble phase, and that during that process gold should deliver a capitulation phase to end the three year bear market. This is a follow up to see how things are playing out now that we have another months' worth of price action behind us.
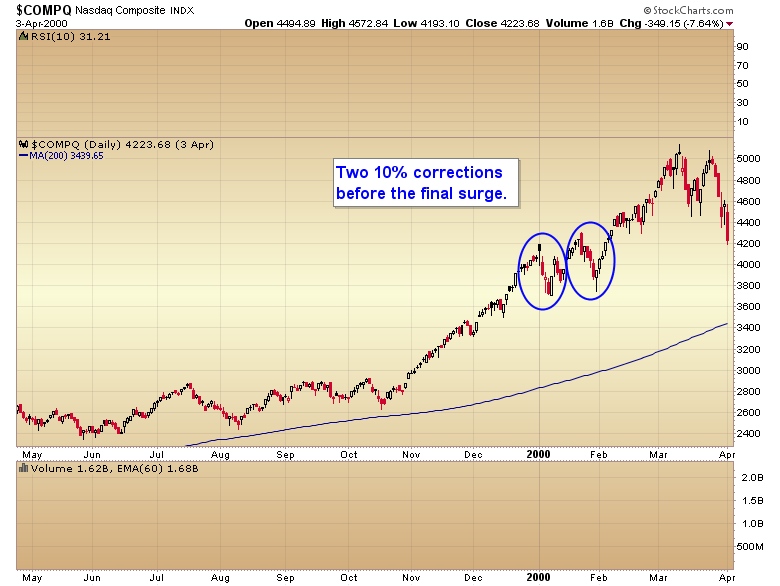
For stocks it still remains to be seen whether or not they have one more surge higher into a final top. If one just looks at the NASDAQ it would appear that stocks have begun moving down into a bear market. However as I pointed out in my previous article it's not unusual to have one, and sometimes two very severe corrections before a final leg up in a ending bubble phase. As I pointed out in my previous article the NASDAQ had two back-to-back 10% corrections before a final 34% surge into that 2000 top.
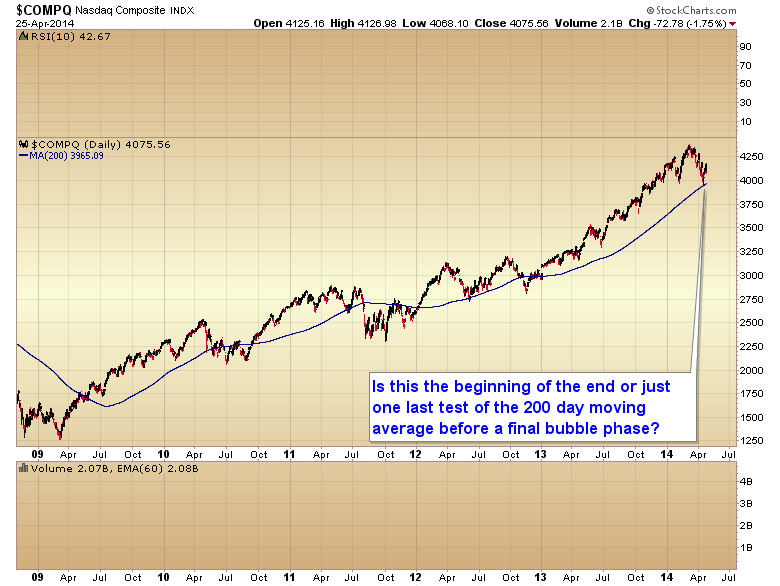
So we have to ask ourselves, is the NASDAQ rolling over into a new bear market or is this just a final correction before one more surge higher? From a long-term perspective this looks like just a normal pullback to the 200 a moving average after a particularly powerful move over the last year.
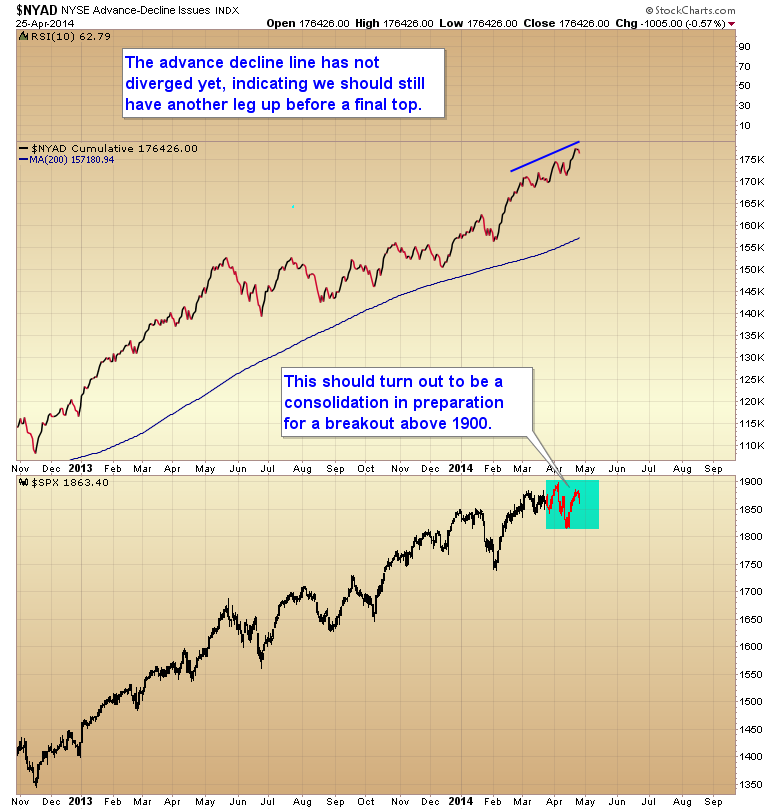
I think at this point one still has to give the benefit of the doubt to the bulls. The fact that the Advance-Decline line is still making new highs suggests that this is probably a consolidation in preparation for a break above that 1900 resistance zone.
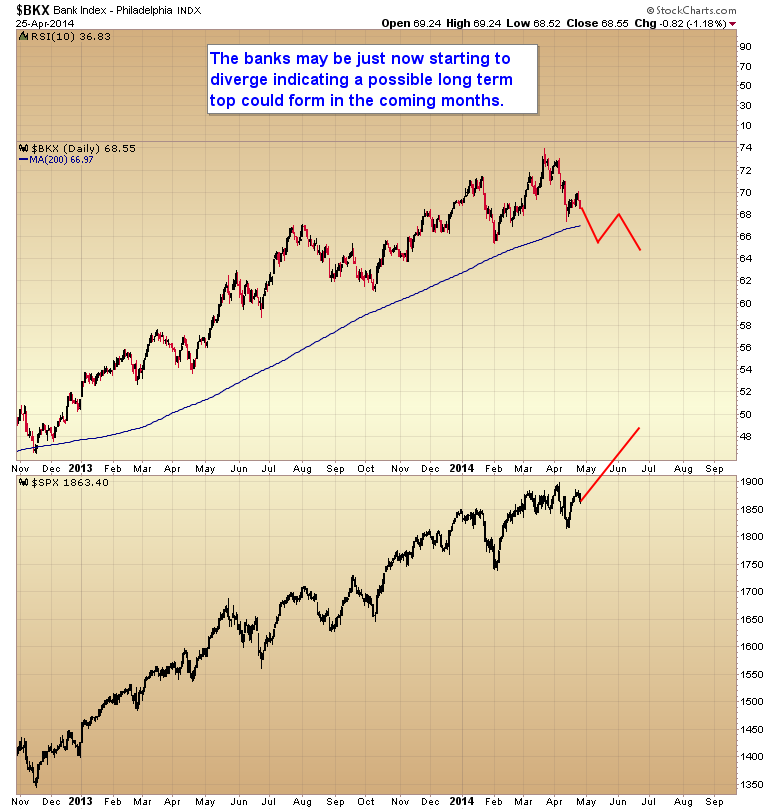
That being said we now have the potential for the banks to start diverging from the general stock market. As I've noted in the past it's not unusual for the banking index to diverge for several months as stocks put in their final top. So if we see the S&P breakout to new highs over the next month or two but the banks continue to lag this would be a strong indication that a final bull market top is forming.
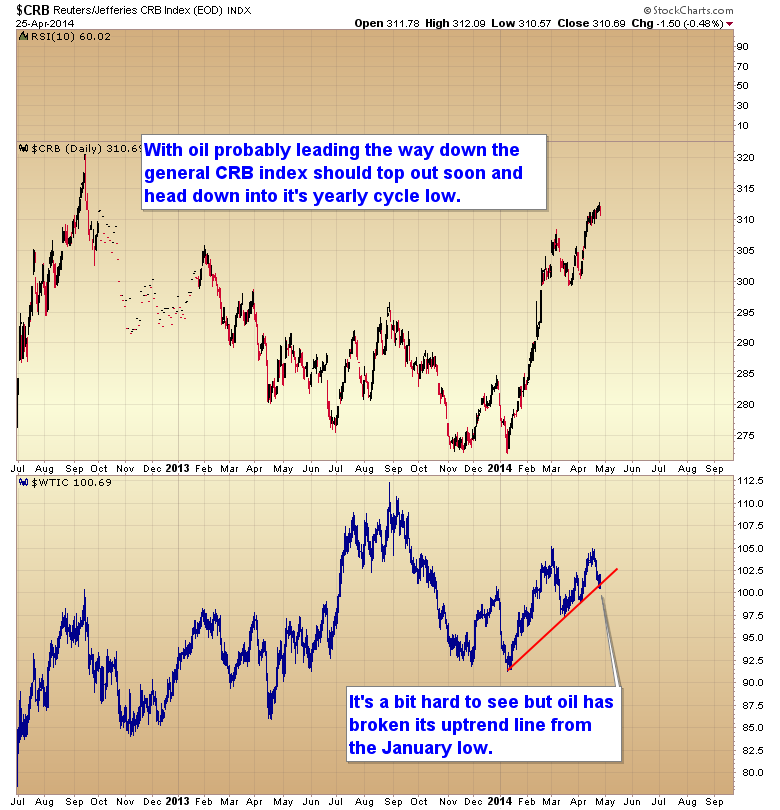
As most of you know my thesis for this year was that stocks would put in a final bull market top sometime this year, probably in the first half of the year, and that during this process liquidity/inflation would begin to leak out of the stock market and move into the commodity markets. We saw that process begin in January as the CRB index delivered a strong initial surge and broke through its three-year downtrend line. After this initial surge is complete commodities should move down into a major yearly cycle correction in early summer followed by a much stronger move in the second half of the year. I think that midyear correction has probably begun.
As oil is the most important global commodity it tends to drive the general commodity index. So when oil begins to move down into that yearly cycle correction the rest of the commodity complex should eventually follow as they top out one by one and follow oil lower.
On Friday oil broke below its major intermediate uptrend line from the January bottom. This trend line break should signal that oil has begun moving down into its yearly cycle low. The CRB should soon follow oil lower, and I doubt that it will move above that 2012 high before rolling over into that intermediate degree midyear correction.
How does this pertain to gold? To begin with I think the capitulation phase that I theorized in my previous report is probably now off of the table. For that scenario to come to fruition, the previous daily cycle needed to drop to the sub $1200 level before bottoming. It looks like gold probably put in that daily cycle low on Thursday at $1268. So does this mean that gold has bottomed and the next bull leg is ready to begin?
While it's possible, I tend to think gold probably still has one more mild leg down before the larger intermediate cycle forms a more lasting bottom. Generally speaking the intermediate cycle in gold usually runs between 20 and 25 weeks. A bottom on Thursday would only be week 16. Also most intermediate cycles have at least four, and sometimes five daily cycles nested within them. As you can see in the chart below the current intermediate cycle only has three daily cycles so far. Unless gold can do something to confirm a short intermediate cycle I think we have to assume gold still has one more daily cycle down before this intermediate decline is complete.
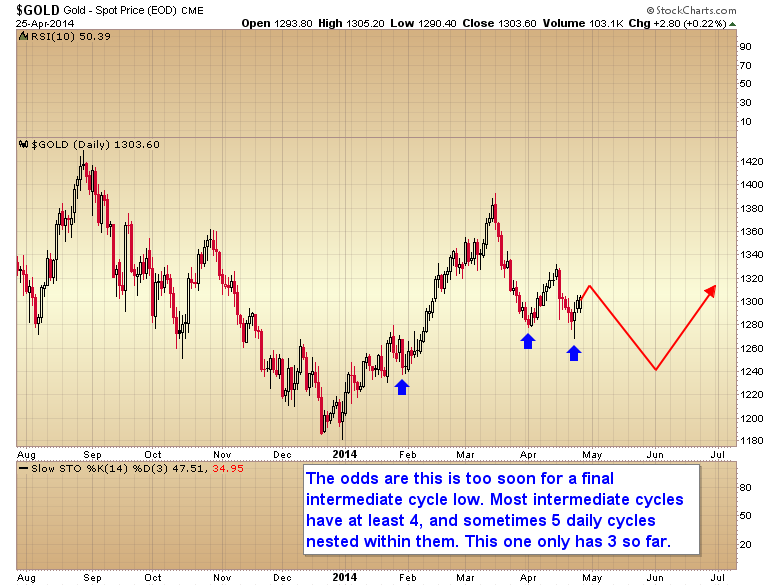
Now that the capitulation phase is probably off the table I think the most likely target for a final intermediate bottom would be in the $1260-$1240 range somewhere around the end of May or beginning of June.
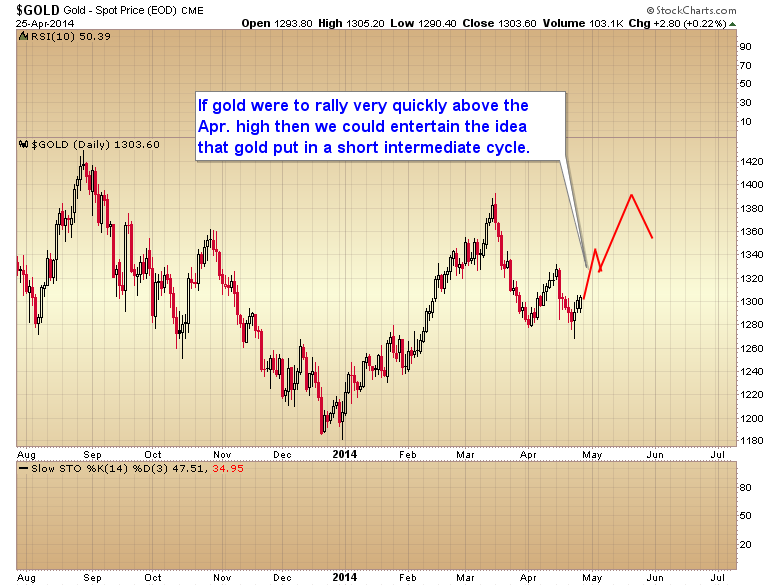
If however gold were to rally very quickly back above the $1331 level by the end of next week then we could entertain the idea of a short intermediate cycle and a final end to gold's three-year bear market. This scenario would probably require that the stock market has put in a final bull market top, and as I noted at the beginning of this article, I'm not convinced that has happened just yet. I tend to think the moves in stocks and gold recently have been greatly influenced by the tensions in Ukraine. If conditions improve I would expect stocks to resume their trend higher and gold to continue down into a normal duration intermediate bottom in late May or early June.
Over the next 1-2 months commodities should move down into that midyear correction in preparation for a very powerful move up during the second half of the year. Gold should follow the rest of the CRB index down into that yearly cycle low, but I will keep an eye on it over the next week or two as the situation in Eastern Europe may push gold into a divergent path from the rest of the commodity complex.
To sample the premium newsletter consider clicking on the subscription button at the top of the GoldScents home page and try a one week trial of the premium service that includes daily and weekend market updates.
Toby Connor
Gold Scents
GoldScents is a financial blog focused on the analysis of the stock market and the secular gold bull market. Subscriptions to the premium service includes a daily and weekend market update emailed to subscribers. If you would like to be added to the email list that receives notice of new posts to GoldScents, or have questions,email Toby.
© 2014 Copyright Toby Connor - All Rights Reserved
Disclaimer: The above is a matter of opinion provided for general information purposes only and is not intended as investment advice. Information and analysis above are derived from sources and utilising methods believed to be reliable, but we cannot accept responsibility for any losses you may incur as a result of this analysis. Individuals should consult with their personal financial advisors.
Toby Connor Archive |
© 2005-2022 http://www.MarketOracle.co.uk - The Market Oracle is a FREE Daily Financial Markets Analysis & Forecasting online publication.