


How Much Energy Will the 2014 World Cup Consume?
Commodities / Energy Resources Jun 13, 2014 - 08:28 PM GMTBy: OilPrice_Com

 Along with 3 billion other viewers around the world, I plan to tune in for the month-long World Cup to see whether the 22-year old Neymar can withstand the colossal pressure that has been put upon his shoulders to deliver a win for team Brazil.
Every time I turn on my television set, I'm using World Cup-related energy. And that's just the start. Flying in teams, trainers, equipment, World Cup personnel and the estimated 500,000-plus fans will use enormous volumes of jet fuel.
Add to that powering the stadiums on game days, moving millions of spectators around host-country Brazil, and transmitting the event to billions of viewers worldwide, and you end up with millions of tons of carbon dioxide added to the atmosphere.
So while the 2014 World Cup is going to be bigger than ever -- it's shaping up to be the most watched, most lucrative and expensive tournament in soccer history -- it's also going to be one of the biggest energy-consuming, greenhouse gas-spewing World Cups in history.
Think about this as the music blasts through the stadium and the fans cheer and scream and the players race up and down the field chasing the ball: The 2014 World Cup tournament will burn through enough energy before it's over to fuel almost every one of the 260 million cars and trucks in the United States for an entire day, or the equivalent of what 560,000 cars use in a year.
Estimating the total energy required to mount such a massive operation with any precision is a fool's errand, but let's take a look at some numbers to get a sense of scale.
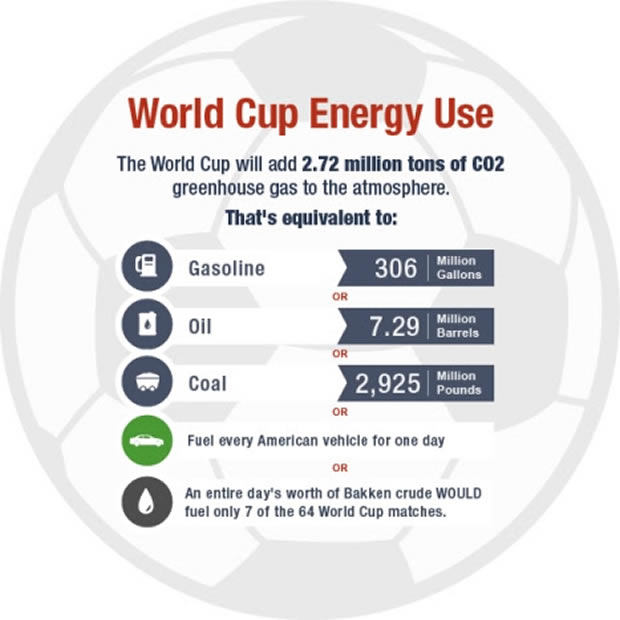
Image source: Oilprice.com
FIFA did its own fascinating study of the carbon footprint that will be created by setting up and running its broadcast television operation. It found that the biggest contributor – 60 percent – is international flights for staff members. The other 40 percent comes from all the trucks needed to transport cables, cameras and furniture, and the energy required to operate all of the electronics.
All told, FIFA's TV operations will contribute 24,670 tons of CO2 to the atmosphere – the same impact of burning 2.8 million gallons of gas, or 13,250 tons of coal.
FIFA also tried to estimate its carbon footprint for staging the tournament's matches, which wraps in the electricity needed for stadiums, fan festivals, banquets, concession stands, training sites, travel for ticket holders, and team hotels. That number came to 2.72 million tons of CO2 equivalent. That's like using up 306 million gallons of gasoline or burning 1.46 million tons of coal.
What's the point of the study? FIFA says to figure out where it can do better next time. Just a 10 percent decline in international staff, for example, reduces the carbon footprint by 6 percent.
TVs and Tea Kettles
None of these numbers include other sources of Cup-related energy use, like building new transportation infrastructure and stadiums.
And speaking of stadiums, while everyone would probably love to attend the final match in Rio de Janeiro's famous Maracana stadium, the vast majority of us will be watching at home. Which means we're contributing to the Cup's carbon footprint, too.
A spike in energy use is likely to occur in places when millions of people turn on their TVs at the same time to watch a match. For example, in the United Kingdom, the record for an energy surge during a TV program occurred during the 1990 World Cup, when England went to a shootout against West Germany in the semi-final. (Incidentally, West Germany prevailed and went on to win the trophy. West Germany's title run was led by Jurgen Klinsmann, who is now coaching the U.S. national team.)
During that match, the UK National Grid experienced a spike of 2,800 megawatts of demand, as people across England tuned in to watch the game's climax. Other significant power surges in the UK occurred during England's 2002 quarter-final match against Brazil (2,570 MW surge), and the 2011 royal wedding of Prince William and Kate Middleton (2,400 MW surge).
In fact, it's relatively common for the UK to experience a spike in power demand during big soccer matches. National Grid operators have become accustomed to forecasting higher electricity demand during games, according to its operations manager, Jon Fenn. Not only does electricity consumption spike from millions of TV sets, a surge is felt most acutely during halftime or just after the final whistle, when everyone heads to the kitchen to turn on electric tea kettles or grab a snack from the fridge.
"It must be one of the few jobs where watching World Cup matches is essential to your work rather than a distraction, because we need to know to the second when half time and full time occur to be ready for the surges in demand," Fenn told The Telegraph in an interview before the 2010 World Cup.
The 2014 World Cup will be transmitted to every country in the world and could potentially be the most watched sporting event in history.
Now we know it could set new records in terms of greenhouse gas emissions, too.
Source: http://oilprice.com/Energy/Energy-General/How-Much-Energy-Will-the-2014-World-Cup-Consume.html
By Nick Cunningham and James Stafford of Oilprice.com
© 2014 Copyright OilPrice.com- All Rights Reserved
Disclaimer: The above is a matter of opinion provided for general information purposes only and is not intended as investment advice. Information and analysis above are derived from sources and utilising methods believed to be reliable, but we cannot accept responsibility for any losses you may incur as a result of this analysis. Individuals should consult with their personal financial advisors.
© 2005-2022 http://www.MarketOracle.co.uk - The Market Oracle is a FREE Daily Financial Markets Analysis & Forecasting online publication.