AUD-USD Fake Out
Currencies / Forex Trading Jun 18, 2014 - 08:04 AM GMTBy: Austin_Galt
Your rugby opponent runs towards you with ball in hand. Just as you’re about to tackle him he feigns to go right, but then steps back to the left and darts off with you in hot pursuit. Just as it is in rugby, so too is it in the market. The market is our opponent and it’s our job to tackle it. It is not our friend. It is our enemy and it will do all it can to elude us. It will play mind games with us. Daring us to do this or that, knowing its only aim is to dupe us. And if we are duped it will do its utmost not to let us catch it after we finally cotton on to the charade. In this case, the AUDUSD looks to have dummied to the high side then sidestepped back to the low side and is now streaking away. Rallies should be small as it makes it hard to get set for those that didn’t pick the initial fake out.
Let’s have a look at the AUDUSD daily chart to see what this is all about.
DAILY CHART

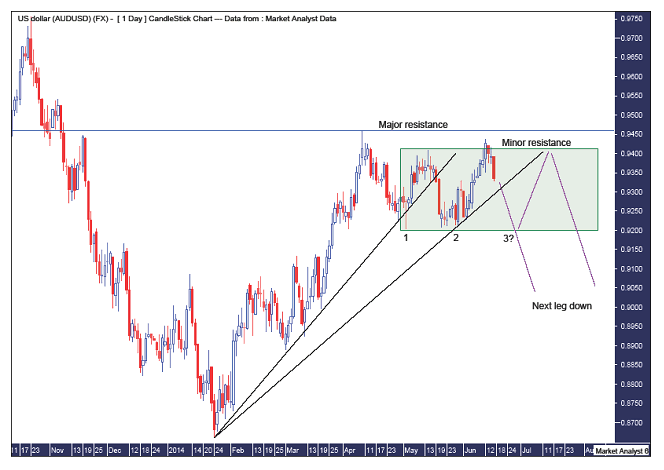
I have redrawn the green rectangle from the previous report. The top of the rectangle is minor resistance stemming from the May high of 94.1c while major resistance is at the April high of 94.6c. We can see price has tickled the minor resistance level but pulled up short of major resistance. Price has then reversed and a sharp move down has ensued. A false breakout of the rectangle shall we say? False breaks are often resolved by a fast move in the opposite direction.
I’ve also drawn a couple of black trend lines. We can see the first sign that price was in the midst of a trend change was when the first and steepest trend line was broken. Price now looks headed for the next trend line and a break of that would be yet more confirmation that the bears are regaining control. A breakdown below the green rectangle would surely be the final nail in the coffin for the bulls.
We can see there have already been two tests of the bottom of the rectangle. Price looks headed back there now. It may crack through or alternatively set up a third low before retesting once more the top of the rectangle. A failure there would surely see price break down on its fourth attempt at support.
It doesn’t matter what level of knowledge we have of the market. The learning process never ceases. We can always improve. The little break higher above 94.1c is a reason why I like to keep my stops at a reasonable distance and positioned at key resistance and support levels. So, in this example, the top of the rectangle was only minor resistance and breaking that level did no damage to the overall bearish technical picture I outlined in my previous AUDUSD report.
Personally, I’ll be looking to add to current short positions on the next decent rally as it is my opinion that the next significant move down is now underway.
Bio
I have studied charts for over 20 years and currently am a private trader. Several years ago I worked as a licensed advisor with a well known Australian stock broker. While there was an abundance of fundamental analysts there seemed to be a dearth of technical analysts, at least ones that had a reasonable idea of things. So my aim here is to provide my view of technical analysis that is both intriguing and misunderstood by many. I like to refer to it as the black magic of stock market analysis.
Please register your interest in my website coming soon. Any questions or suggestions, please contact austingalt@hotmail.com
© 2014 Copyright Austin Galt - All Rights Reserved
Disclaimer: The above is a matter of opinion provided for general information purposes only and is not intended as investment advice. Information and analysis above are derived from sources and utilising methods believed to be reliable, but we cannot accept responsibility for any losses you may incur as a result of this analysis. Individuals should consult with their personal financial advisors.
© 2005-2022 http://www.MarketOracle.co.uk - The Market Oracle is a FREE Daily Financial Markets Analysis & Forecasting online publication.


