


AUD/USD Forex Rally Continue?
Currencies / Forex Trading Jul 02, 2014 - 10:47 AM GMTBy: Nadia_Simmons

 The Reserve Bank of Australia left interest rates unchanged at a record low of 2.5%, which pushed the Australian dollar to a seven month high against its U.S. counterpart earlier today. Thanks to this news AUD/USD climbed temporarily above important resistances, but will currency bulls be strong enough to hold gained levels?
In our opinion, the following forex trading positions are justified - summary:
EUR/USD: none
GBP/USD: none
USD/JPY: none
USD/CAD: none
USD/CHF: none
AUD/USD: none
EUR/USD
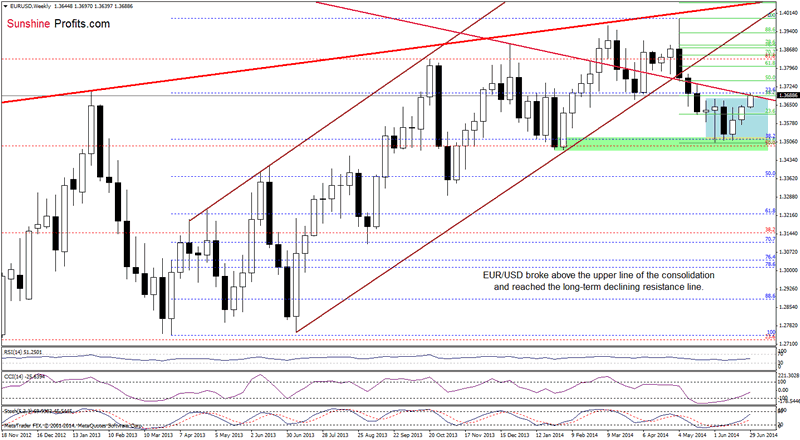
The situation in the medium term remains unchanged as EUR/USD is still trading slightly below its major resistance. Therefore, our last commentary is up-to-date:
(…) If the long-term declining line encourages forex traders to push the sell button, we’ll see a pullback from here and a comeback to the consolidation range. However, if this important line is broken, we’ll see further improvement and an increase to at least 1.3746, where the 50% Fibonacci retracement is (you’ll see this level more clearly on the daily chart below). Please keep in mind that the CCI and Stochastic Oscillator generated buy signals, which supports the bullish case at the moment.
What can we infer from the very short-term chart?
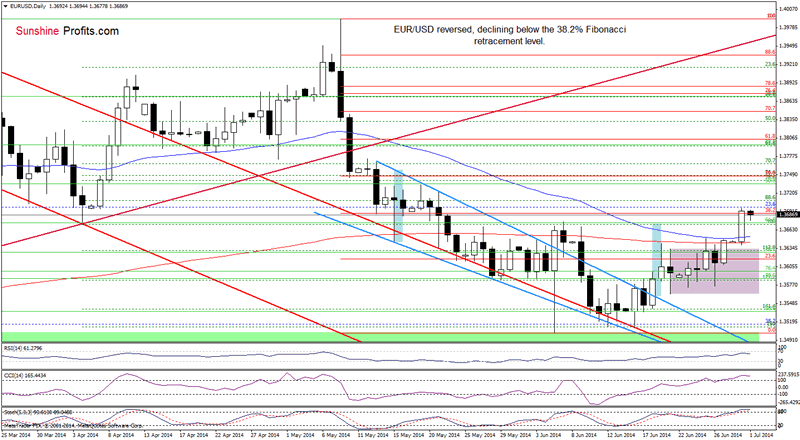
Looking at the above chart, we see that the exchange rate reversed and declined temporarily below the 38.2% Fibonacci retracement earlier today. However, taking into account the size of a pullback, it seems to us that’s too early to say that the very short-term situation has deteriorated. In our opinion, as long as EUR/USD is trading so close to this important support/resistance line, what we wrote yesterday is valid:
(…) if (…) the 38.2% Fibonacci retracement holds, we’ll see a pullback to the previously-broken moving averages (around 1.3643-1.3651). On the other hand, if it is broken and we see further rally (which also means a breakout above the long-term declining resistance line), the next upside target will be the 50% Fibonacci retracement (around 1.3746). Please note that the RSI reached its highest level since the beginning of May, while the CCI and Stochastic Oscillator are overbought, which suggests that the space for growth might be limited.
Very short-term outlook: mixed
Short-term outlook: bearish
MT outlook: bearish
LT outlook: bearish
Trading position (short-term): In our opinion no positions are justified from the risk/reward perspective at the moment.
USD/JPY
The situation in the medium term hasn’t changed much as USD/JPY remains between the medium-term support/resistance and the May low of 100.81. Today, we’ll focus on the very short-term picture.
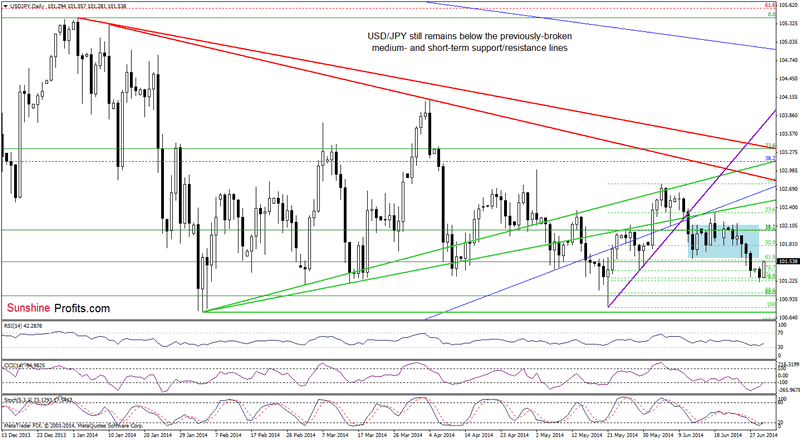
On Friday, we wrote the following:
(…) the pair reached a support zone created by the 76.4% and 78.6% Fibonacci retracement levels based on the recent rally. If it withstand the selling pressure, we’ll see a corrective upswing to the lower line of the consolidation at 101.59.
As you see on the daily chart, the exchange rate bounced off the support zone and it seems to us that currency bulls will realize the above-mentioned in the nearest future. From this perspective, we see that the RSI rebounded, while the CCI and Stochastic Oscillator generated buy signals, which suggests that we will also see a breakout above the lower border of the consolidation. If this is the case, the next upside target will be around 102.12, where the upper line of the formation is.
Very short-term outlook: mixed with bullish bias
Short-term outlook: mixed
MT outlook: mixed
LT outlook: bearish
Trading position (short-term): In our opinion no positions are justified from the risk/reward perspective at the moment.
AUD/USD
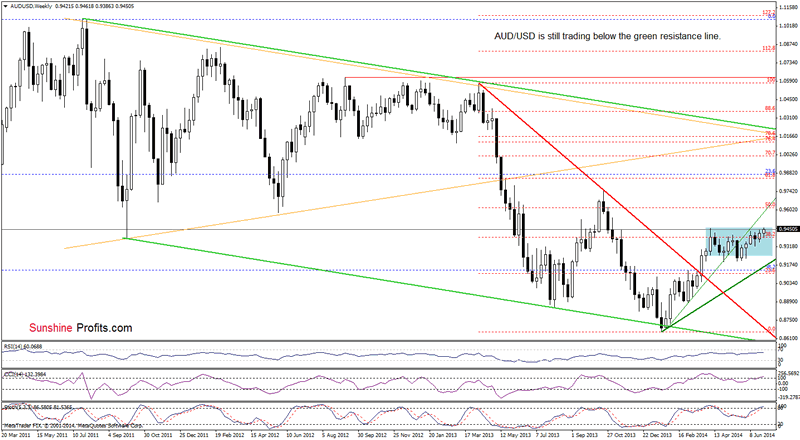
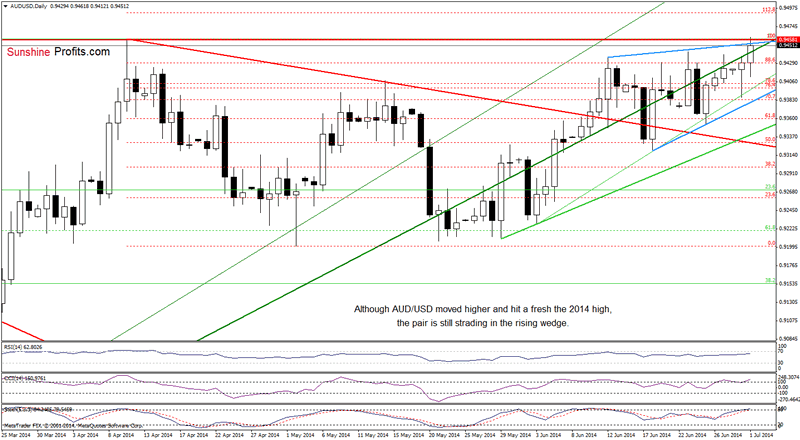
Although AUD/USD hit a fresh 2014 high, the situation in the medium term hasn’t changed much as the exchange rate still remains in the consolidation below the medium-term green resistance. Nevertheless, if currency bulls do not give up and manage to push the pair higher, the next upside target will be around 0.9575, where the major resistance line is at the moment.
Will the very short-term picture give us any interesting clues about future moves?
Quoting our last Forex Trading Alert:
(…) we think that we’ll see another sizable move only if AUD/USD breaks above the upper line of the rising wedge (marked with blue) or declines under the lower line of this formation. If we see a breakout, the upside target will be around 0.9523, where the next medium-term resistance line is.
Looking at the above chart, we see that the exchange rate extended rally and broke above the strong resistance zone created by the previous 2014 high and the upper line of the rising wedge. So far, this improvement was only temporarily and the pair declined slightly. However, if AUD/USD extends losses and closes the day below these lines, the breakout will be invalidated, which will be a strong bearish signal that will likely trigger a correction to the medium-term green support line or even to the lower border of the rising wedge (which is quite likely when we factor in the current position of the indicators). Nevertheless, as long as there are no sell signals and the pair remains very close to the resistance zone, another attempt to move higher can’t be ruled out.
Very short-term outlook: mixed
Short-term outlook: mixed
MT outlook: bearish
LT outlook: bearish
Trading position (short-term): In our opinion no positions are justified from the risk/reward perspective at the moment.
Thank you.
Nadia Simmons
Sunshine Profits‘ Contributing Author
Oil Investment Updates
Oil Trading Alerts
* * * * *
Disclaimer
All essays, research and information found above represent analyses and opinions of Nadia Simmons and Sunshine Profits' associates only. As such, it may prove wrong and be a subject to change without notice. Opinions and analyses were based on data available to authors of respective essays at the time of writing. Although the information provided above is based on careful research and sources that are believed to be accurate, Nadia Simmons and his associates do not guarantee the accuracy or thoroughness of the data or information reported. The opinions published above are neither an offer nor a recommendation to purchase or sell any securities. Nadia Simmons is not a Registered Securities Advisor. By reading Nadia Simmons’ reports you fully agree that he will not be held responsible or liable for any decisions you make regarding any information provided in these reports. Investing, trading and speculation in any financial markets may involve high risk of loss. Nadia Simmons, Sunshine Profits' employees and affiliates as well as members of their families may have a short or long position in any securities, including those mentioned in any of the reports or essays, and may make additional purchases and/or sales of those securities without notice.
© 2005-2022 http://www.MarketOracle.co.uk - The Market Oracle is a FREE Daily Financial Markets Analysis & Forecasting online publication.