


Crude Oil Price Heading North or South?
Commodities / Crude Oil Jul 03, 2014 - 10:30 AM GMTBy: Nadia_Simmons

 On Tuesday, crude oil lost 0.30% as the combination of Chinese and U.S. data weighed on the price. Because of these numbers, light crude declined temporarily below its nearest support zone and closed the day slightly above it for the second day in a row. Will we see a breakdown or a rebound from here?
Yesterday, government data showed that China’s official manufacturing PMI increased to a six-month high of 51.0 in June (up from 50.8 in May, but in line with expectations), while another report showed that China’s final HSBC Purchasing Managers Index came in at 50.7, higher than May's 49.4 figure, but weaker than a preliminary reading of 50.8. Meanwhile in the U.S., the Institute for Supply Management reported that its index of purchasing managers declined to 55.3 last month from a reading of 55.4 in May, while analysts had expected an increase to 55.8 in June. How did these fundamental factors affected the technical picture of crude oil? Let’s check (charts courtesy of http://stockcharts.com).
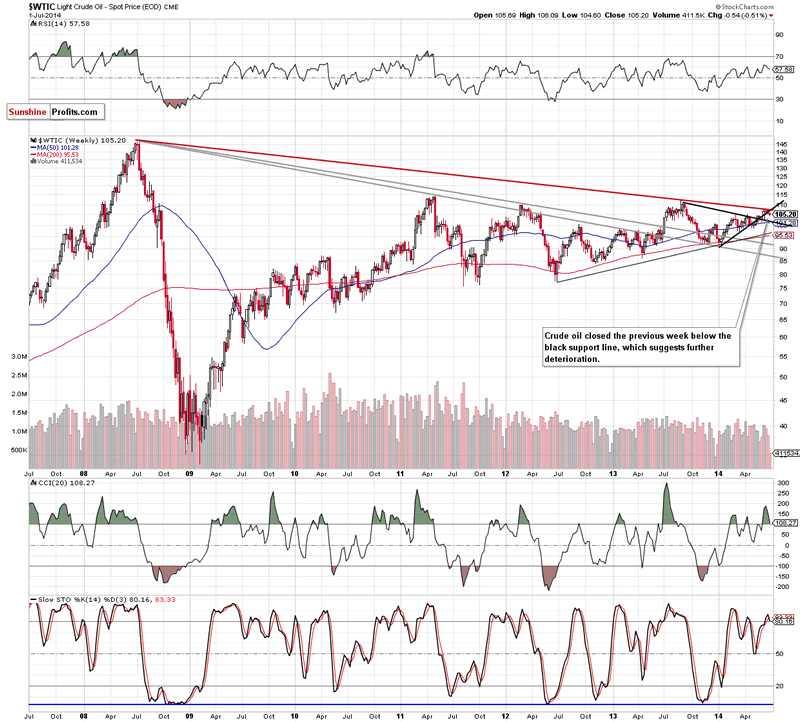
As you see on the weekly chart, crude oil still remains below the previously-broken medium-term black rising line, which suggests further deterioration. Therefore, what we wrote in our last Oil Trading Alert is up-to-date:
(…) If (…) oil bulls do not invalidate the breakdown, we’ll see a downward move to around $102, where the declining black medium-term support line and the 50-week moving average are.
Once we know the medium-term picture, let’s take a closer look at the daily chart.
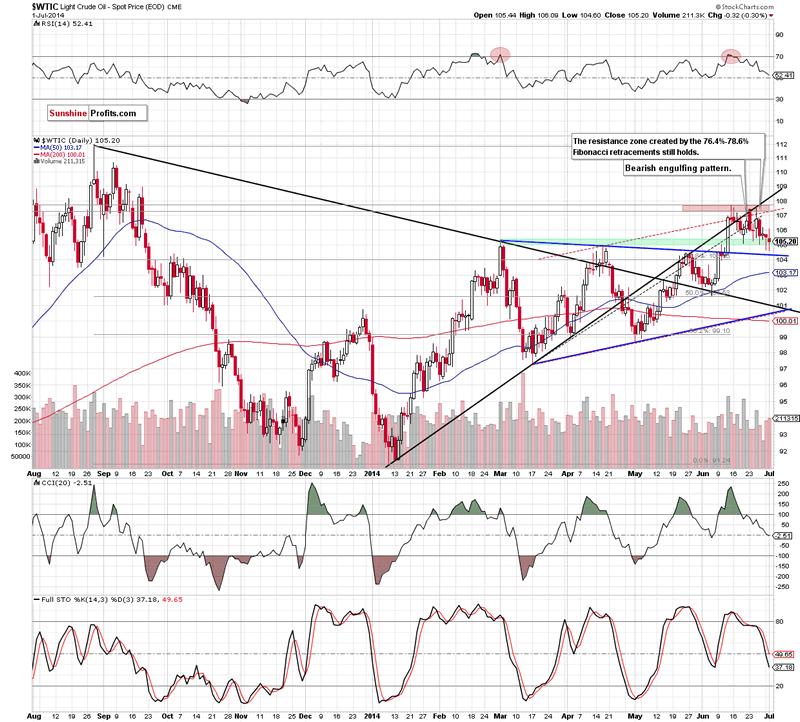
From this perspective, we see that although crude oil moved higher after the market’s open, the commodity reversed and extended losses, declining temporarily below the green support zone. Similarly to what we saw on Monday, the proximity to the blue support line encouraged oil bulls to act and light crude rebounded, coming back to its green support zone. Therefore, our last commentary is still valid:
(…) If this support zone holds, we’ll see another corrective upswing to around $107.30-$107.68, where the resistance zone is. On the other hand, if oil bears do not give up and show their claws one again, we will see a breakdown in the nearest future and a correction to at least the previously-broken blue support line (currently around $104.40). Please keep in mind that sell signals generated by the indicators remain in place, supporting the bearish scenario.
Summing up, although crude oil approached its downside target once again, the proximity to the blue support line triggered a corrective upswing that took back the commodity to the narrow range between the green support and red resistance zone. Just like we wrote in our last summary, as long as there is no confirmed breakdown or breakout below/above one of these key areas another sizable move is not likely to be seen. Nevertheless, the current position of the indicators and the breakdown below the black support line on the weekly chart suggest that further correction and lower values of crude oil are just around the corner.
Very short-term outlook: bearish
Short-term outlook: mixed with bearish bias
MT outlook: mixed
LT outlook: mixed
Trading position (short-term; our opinion): Short. Stop-loss order at $109.20.
Thank you.
Nadia Simmons
Sunshine Profits‘ Contributing Author
Oil Investment Updates
Oil Trading Alerts
* * * * *
Disclaimer
All essays, research and information found above represent analyses and opinions of Nadia Simmons and Sunshine Profits' associates only. As such, it may prove wrong and be a subject to change without notice. Opinions and analyses were based on data available to authors of respective essays at the time of writing. Although the information provided above is based on careful research and sources that are believed to be accurate, Nadia Simmons and his associates do not guarantee the accuracy or thoroughness of the data or information reported. The opinions published above are neither an offer nor a recommendation to purchase or sell any securities. Nadia Simmons is not a Registered Securities Advisor. By reading Nadia Simmons’ reports you fully agree that he will not be held responsible or liable for any decisions you make regarding any information provided in these reports. Investing, trading and speculation in any financial markets may involve high risk of loss. Nadia Simmons, Sunshine Profits' employees and affiliates as well as members of their families may have a short or long position in any securities, including those mentioned in any of the reports or essays, and may make additional purchases and/or sales of those securities without notice.
© 2005-2022 http://www.MarketOracle.co.uk - The Market Oracle is a FREE Daily Financial Markets Analysis & Forecasting online publication.